Exemple : in a candies factory, we want to know if 2 machines fill bags with the same weight of candies. Thus, we proceed 2 samplings (N1 bags aleatory taken from machine 1 and N2 bags aleatory taken from machine 2), then we calculate the mean weight in each sample. The goal of our study is to compare those 2 mean weights in order to know if gap between both weights is significant or simply due to chance.
1 - Principles of t-test for comparison of 2 means from 2 different subjects groups (independent groups) :
We have 2 samples a and b wose means (ma and mb) and variances (s²a and s²b) are estimators of means (µa and µb) and variances (θ²a et θ²b) of the 2 populations A and B from which samples are extracted. The question is : if ma and mb are different (which is easy to check), is it the same for µa and µb ?
- Null hypothesis : "H0 = µa and µb are equal"
- Alternative hypothesis : "H1 = µa and µb are different"
We check values of the difference d = (ma - mb). If both samples com from 2 populations with a same mean, d will be close to 0.
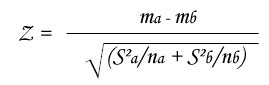
- In case of great effectives (n > 30), we can estimate θ²a and θ²b by variances caculated from samples : s²a et s²b, we compare Z value with the limit value from the Z statistic table :
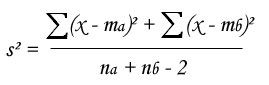
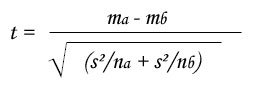
- In case of small effectives, we can not estimate any more θ²a and θ²b by variances caculated from samples, then we calculate a unique variance s², estimation of the common variance θ² :
and we compare t value with the limit value from the Student table with df = na + nb - 2 :
- Conditions to use the test (automatically checked by StatEL) :
- Normal distribution of the samples
- Homogeneity of variances
2 - Launch of t-test for comparison of 2 means from 2 different subjects groups (independent groups) :
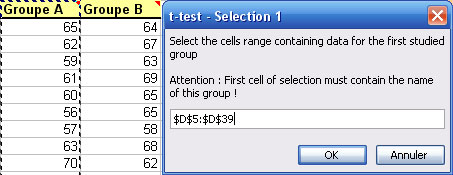
StatEL requires you to select the cells range related to the first studied group, then it needs you to select the cells range related to the second group of subjects. To proceed the selection, you just have to clic on the first cell of your data with the mouse and to stretch until the last cell of your data.
Nota bene : in order to identify at the best different measures groups, first cell of each selection must contain name of the group. These names will be used in the results sheet.
3 - Resultats of t-test for comparison of 2 means from 2 different subjects groups (independent groups :
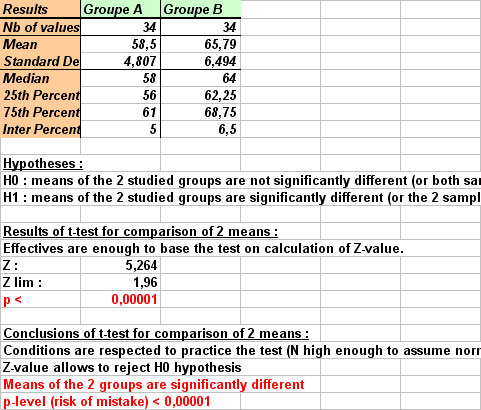
Results display on a new sheet of you Excel file :
- On the left part of the sheet, you can see table of selected data.
- On the right part of the sheet are displayed table of descriptive statistics, tested hypotheses, results of t-test calculation, and t-test's conclusions. If results allow to reject H0 hypothesis, i.e. if means of both groups are significantly different, conclusions as well as p-value are written in red.
- If conditions of t-test are not respected, a red warning message is written, as well as the name of the nonparametric test analogous to the t-test that you can use to perform a correct statistical analysis.
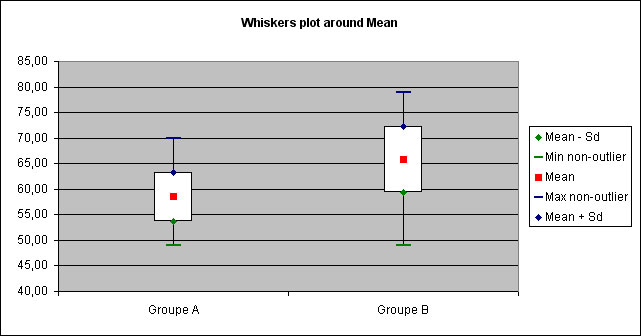
In the mentioned example, StatEL explains clearely that means of the 2 groups are significantly different, with a p-value (risk to make a mistake) lower than 0,00001.
It is also specified that conditions of the test are respected (conditions checked with StatEL, transparently for the user) ; the user can thus trust results.
A "Whiskers plot" is displayed to illustrate results :
|