| |
StatEL allows to test the existence of linear link between 2 quantitative variables whose distribution of measures does not allow utilization of parametric tests. Spearman's correlation test is the nonparametric test equivalent to Pearson's correlation test.
1 - Principles of Spearman's correlation test :
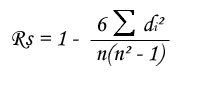
The Spearman's correlation coefficient (Rs) allows to test the existence of linear link between 2 quantitative variables and also its intensity. Its square value, coefficient of determination (R²) specifies the percentage of points variance that is explained by the regression linear model.
- Null hypothesis : "H0 : Rs = 0 ..."
- Alternative hypothesis : "H1 : Rs is different from 0 "
In any nonparametric test, and on the contrary of parametric tests, calculation does not take into account numeric values of measures from samples representative of the populations. Nonparametric tests are based on ranks of values. Then we are free of normal distribution conditions and homogeneity of variances, indispensable for liability of parametric tests.
- We begin to rank separately X values and Y values. If there is really a positive linear link between X and Y, ranks calculation will reveal that subjects with low X values (i.e. low rank value) have also low Y values (i.e. low rank value), and on the contrary subjects with high X values have also high Y values. On the other hand, if there is no linear link between X and Y, subjects with low X values have Y values very different in their ranking.
- If N > 9, we can test significancy of Rs thanks to Pearson's correlation formulae. If N < 10, we compare Rs to critical value issued from Spearman table.
- Another way to calculate Spearman's correlation is to apply caculations of Pearson's correlation to ranks, instead of values.
2 - Launch of Spearman's correlation test :
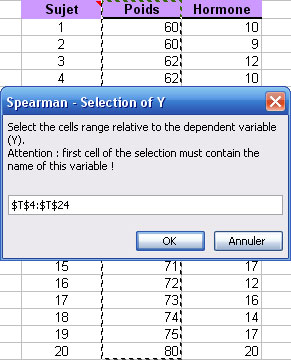
StatEL requires you to select successively the cells range related to each variable. To proceed the selection, you just have to clic on the first cell of your data with the mouse and to stretch until the last cell of your data.
Nota bene : in order to identify at the best different measures groups, first cell of each selection must contain name of the variable. These names will be used in the results sheet.
Nota bene : in a Spearman's correlation test, number of measures is supposed to be the same for each group, since it concerns pairs of measures. However, StatEL will manage missing data if, for each group, selection is applying on exactly the same number of cells (empty or not).
3 - Results of Spearman's correlation test :
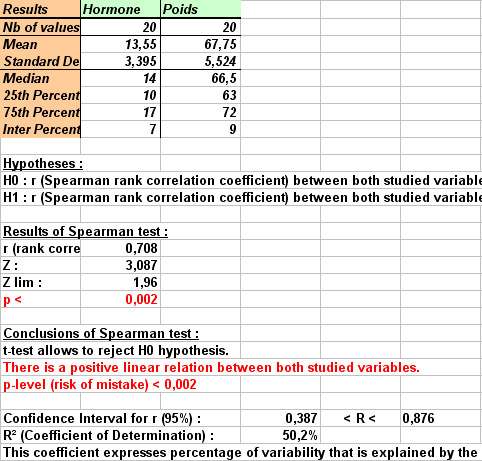
Results display on a new sheet of you Excel file :
- Sur la partie gauche de la feuille sont affichés, sous forme de tableau, les données sélectionnées.
- On the right part of the sheet are displayed table of descriptive statistics, tested hypotheses, results of Friedman test calculations, and Friedman test conclusions. If results allow to reject H0 hypothesis, i.e. if Rs is significantly different from 0, conclusions as well as p-value are written in red.
In the mentioned example, StatEL explains clearely that Rs is significantly different from 0, with a p-value (risk to make a mistake) lower than 0.00047.
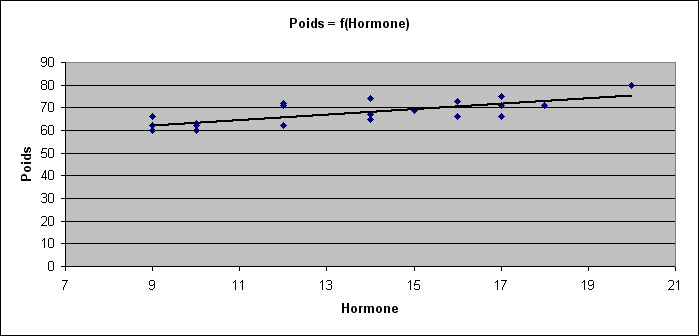
- A graph with Y = f(X) is displayed, with a linear regression model if Rs is significantly different from 0.
|