| |
 |
StatEL : Simple Linear Regression /
Pearson's Correlation Coefficient
|
|
|
|
| |
1 - Principles of simple linear regression / Pearson's Correlation :
Considering 2 quantitative variables measured on one group of subjects, we have a pairs data set (x, y). On a graph, we can also draw a line that passes through these points and whose intercept and slope will minimize its distance with the whole points set (least square method).
Thus, if both variables are independent, X value is not informative on Y value, and the line that passes the closest of every points has a close to 0 slope (horizontal line).
On the contrary, if both variables are linked, X value is not informative on Y value, and the line that passes the closest of every points has a different from 0 slope.
Another parameter, Pearson's correlation coefficient (r) is also informative about existence of a linear relation between 2 quantitative variables and also about its strength. Coefficient of determination (R²) specifies the percentage of points variance that is explained by the linear regression model.
Correlation and regression are closely related, however we do not use them in the same circumstances :
- If we consider, for example, marks in english and mathematics of one pupils group, we want to know if results in both are linked or independent. This is typically a correlation problem because none of the both variables is explicative, in one pair os measures, x and y vary freely.
- On the contrary, if we consider a dose/effect study (ex : injection of insuline and measure of glycemia), the "injection of insuline" variable is controlled and explicative on the "glycemia" variable. This is typically a regression problem.
In other words : in a correlation case, both variables vary aleatory, we are in an observation situation ; in a regression case, only one variable vary aleatory (the dependent or explicated variable : Y), the other variable is controlled (the independent or expliquative varaible : X), we are in an experiment situation.
Nevertheless, it is also possible to realize a simple linear regression with 2 dependent variables.
One more thing : when you work with repeated measures for each subject, StatEL applies a specific treatment to your data. This is Chi Sang Poon's treatment to take into account withi and between-subjects variances (implemented thanks to help of Pr Melot, Brussels, BELGIUM).
Conditions to use simple linear regression or Pearson's correlation :
- Normal distribution of both studied variables
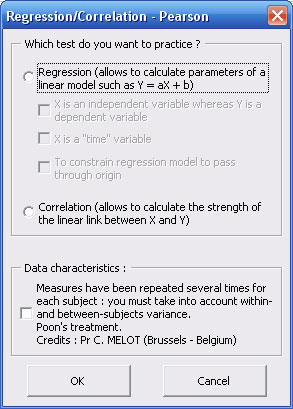
2 - Launch of simple linear regression / Pearson's Correlation :
StatEL needs you first to specify the kind of analysis you want to perform.
Then, you have to select successively the cells range related to each variable. In the case of comparison of 2 linear regression models, selection must be repeated for the 2nd model. To proceed the selection, you just have to clic on the first cell of your data with the mouse and to stretch until the last cell of your data.
Nota bene : in order to identify at the different measures groups, first cell of each selection must contain name of the variable. These names will be used in the results sheet.
Nota bene : in a regression or correlation study, number of measures is supposed to be the same for each group, since it concerns pairs of measures. However, StatEL will manage missing data if, for each group, selection is applying on exactly the same number of cells (empty or not).
3 - Results of simple linear regression / Pearson's Correlation :
Results display on a new sheet of you Excel file :
3.1 - Simple Linear Regression :
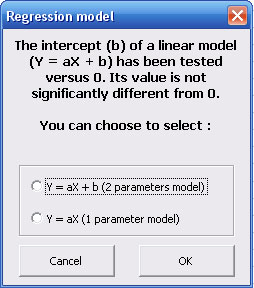
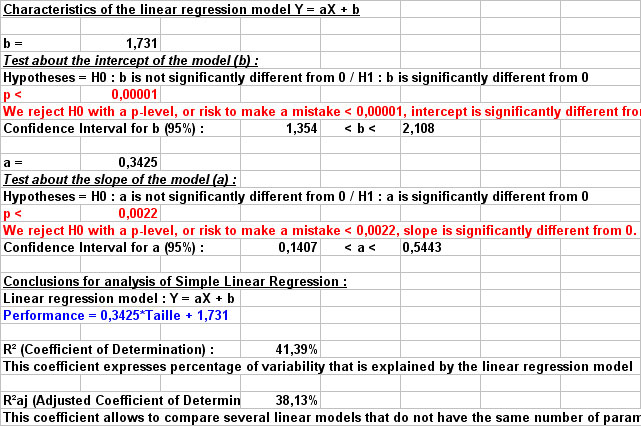
This test is based on study of significativity for calculated parameters of the linear equation (Y = aX + b). First, analysis concerns the intercept (b) and tests if it is significantly different from 0, then analysis concerns the slope (a) to tests if it is also significantly different from 0.
If intercept (b) is not significantly different from 0, a dialog box will ask you if you need a linear model with (Y = aX + b) or without intercept (Y = aX).
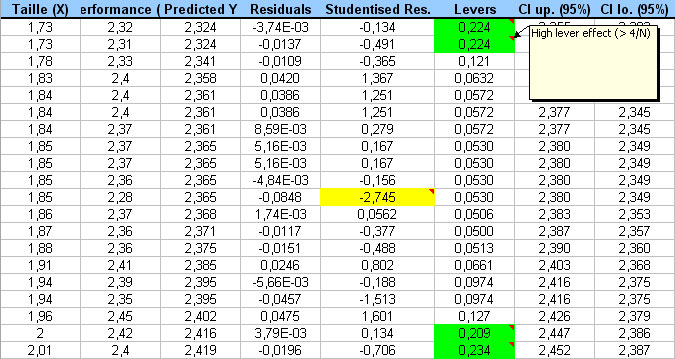
- On the left part of the results sheet are displayed on a table, selected data, calculated Y values (thanks to linear model), residuals, studentized residuals, levers of each data pair and limits of 95% confidence interval of the simple linear regression model :
Sudentized residuals with highest values (>2 ou <-2) are highlighted with yellow bacground and an associated comment ; it is the same for highest levers (in green).
- On the left part of the results sheet are displayed table of descriptive statistics, parameters of the linear regression model, as well as analysis conclusions.
- Beneath, you will find the whole procedure in order to evaluate quality of your linear regression model ; this part of the linear regression model analysis is more subjective and can not be automatized. It is nevertheless displayed to users in order to have criticized look on their own results :
- signs test is a nonparametric test to analyse linearity of the regression model.
- study of studentized residuals,
- levers effect of points pairs,
- Durbin-Watson's test if independant variable is a time variable,
- normality of residuals distribution.
- Then some graphs are displayed to illustrate : graph of Y = f(X) with 95% confidence interval, graph of observed Y vs calculated Y, graph of studentized residuals, graph of levers effect, Q-plot.
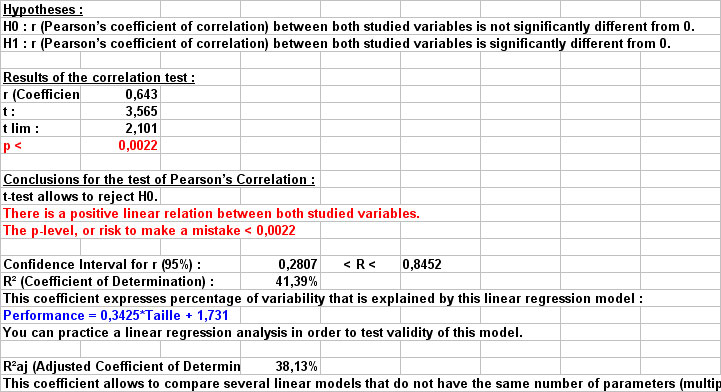
3.2 - Pearson's Linear Correlation :
This test is based on calculation of Pearson's correlation coefficient (r) and parameters of the simple linear regression model (Y = aX + b). We test if Pearson's correlation coefficient (r) is significantly different from 0.
- On the right part of the sheet are displayed table of descriptive statistics, Pearson's correlation coefficient, determination coefficient and adjusted determination coefficient as well as parameters of the simple linear regression model, and the test conclusions. If results allow to significantly reject H0 hypothesis, i.e. if Pearson's correlation coefficient (r) is significantly different from 0, conclusions as well as p-value are written in red.
- If conditions of test on Pearson's correlation coefficient are not respected, a red warning message is written, as well as the name of the nonparametric test that you can use to perform a correct statistical analysis.
|
|
|
| |
|
ad Science Company - 55, Boulevard Pereire, 75017 PARIS - France
|
|
|
|