1 - Launch of Calculations of Sensitivity / Specificity :
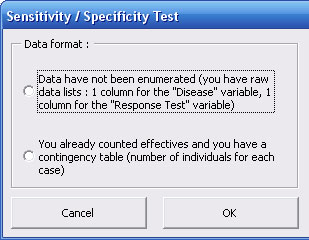
StatEL offers you the ability to work on raw data or on a contingency table :
1.1 - Raw data :
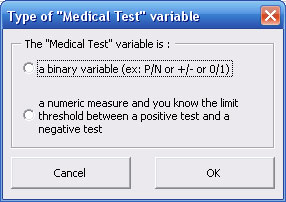
StatEL offers you the ability to work with a binary "Diagnosis" variable (ex : positive or negative test) ou numeric "Diagnosis" variable (in this case, a threshold allows to specify if test is positive or negative) :
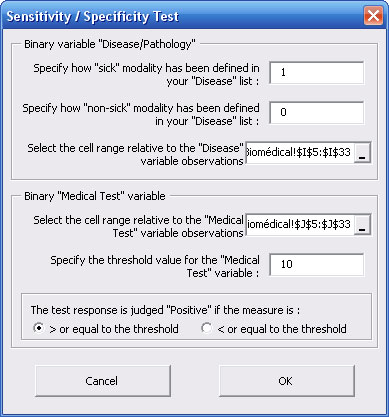
Thus, StatEL needs you to specify nature of "Diagnosis" or "Medical test" variable :
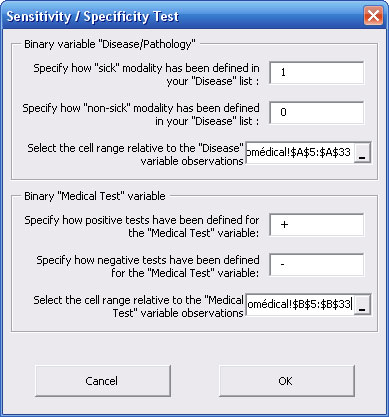
A dialog box appears to specify how are identified subjects that have the studied disease and healthy subjects, then you have to select the cells range relative to the "Disease" variable.
In the same way, you have to specify how are identified positive and negative "Medical test" as well as to select the cells range relative to the "Diagnosis" or "Medical Test" variable.
Nota bene : every selection must contain the same number of cells, otherwise a warning message will pop up.
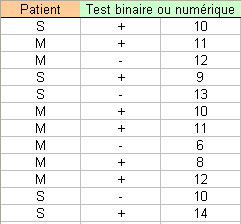
In the case of a numeric "Medical Test" variable, you have to specify the threshold value distinguishing "Positive" and "Negative" test (threshold value = 10 in our example), as well as the cells range relative to the "Diagnosis" or "Medical Test" variable.
By default, "Diagnosis" or "Medical Test" is considered "Positive" when measure is higher than threshold value, you can specify that a test is considered as "Positif" when measure is lower than threshold value.
Click on "Calculation of diagnostic indexes" button to launch calculations.
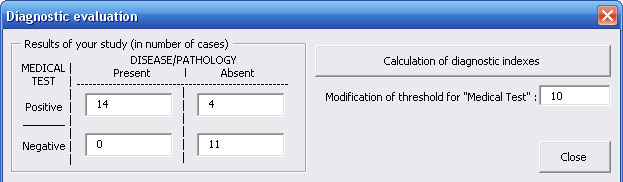
1.2 - Numbered data :
You have already counted effectives of subjects that have the studied disease and healthy subjects, and effectives of subjects with positive and negative "Medical test".
You just have to specify the numbers of cases in the right box.
Click on the "Calculation of diagnostic indexes" button to launch calculations.
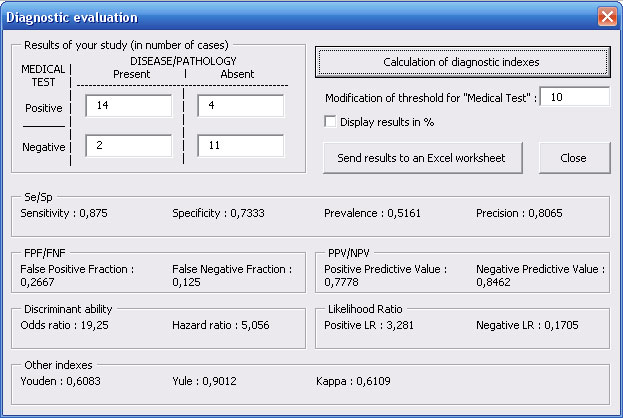
2 - Results of Calculations of Sensibility / Specificity :
They are displayed on the same dialog box :
- Sensibility (proportion of subjects that have the disease with a positive medical test)
- Specificity (proportion of subjects that do not have the disease with a negative medical test)
- False Positive Fraction (proportion of subjects that do not have the disease among subjects with a positive medical test)
- False Negative Fraction (proportion of subjects that have the disease among subjects with a negative medical test)
- Positive Predictive Value (proportion of subjects that have the disease among subjects with a positive medical test)
- Negative Predictive Value (proportion of subjects that do not have the disease among subjects with a negative medical test)
- Odds Ratio and Hazard Ratio represent discriminant ability of the "Diagnosis" or "Medical Test" variable
- Disease Prevalence (proportion subjects that have the disease among studied subjects)
- Precision of the test (proportion of studied subjects that have been correctly diagnosed by the medical test)
You can display the whole results in percentage by ticking the proper case.
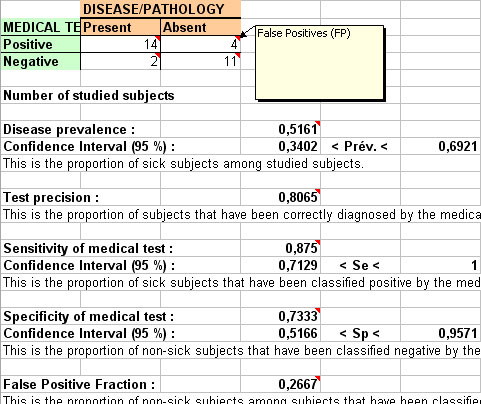
You can also copy the whole results in a new Excel sheet by clicking on "Send results in an Excel worksheet".
Nota bene : if you change only 1 parameter, the whole results disappear from the dialog box.
Nota bene : if you change the threshold value (in case of a numeric "Medical test", effectives calculations are automatically updated and the whole results disappear from the dialog box.
|