|
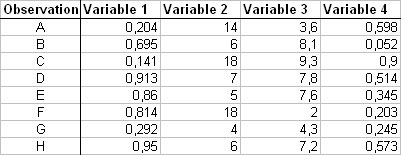
This command launches analysis procedure of a measures table (numerical values of a group of observations for a set of quantitative variables ) :
1 - Principles of Principal Components Analysis :
Graphical representation of a measures table can be made very easily as soon as we have very few variables : it will be plane if there is only 2 variables (one for abscissa and one for ordinate), it will be in 3 dimensions if we add a third variable. Representation is impossible if number of variables is higher than 3, since it requires an axis to code each variable.
Principle of PCA is to synthesize informations contained in a measures table, whatever the number of variables and observations, by detecting main tendencies of this table, due to variables as well as observations.
PCA allows to detect axes (= principal components) by which points spread the most. These "synthetic" axes may result of influence of one or several variables or observations.
Thus, by projection of points (observations or variables) on plans defined by these new axes, we have a representative "photograph" of points.
By analogy, imagine someone is trying you to recognize an animal drawn on a paper sheet (that is a camel) but you see only its face shape. You can not conclude if it is a camel or a dromedary, just because angle of analysis is not the most informative. You need a profile image of the animal to conclude with certitude that it is a camel. On the same way, PCA calculates new axes (and then plans) able to advise you at the best about repartition of points.
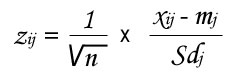
On a technical point of view, it requires diagonalisation of inertia matrix. We proceed to transformation of measures table on this way :
- a table of measures with n observations and k variables,
- xij is measure for observation i, on variable j,
- i varies from 1 to n, j varies from 1 to k,
- mj is the mean of variable j,
- Sdj is the standard-deviation of variable j.
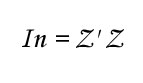
We obtain the matrix Z (n, k) from which we calculate inertia matrix of observations :
After diagonalisation of this matrix, we extract eigenvalues (λ) and matrix of eigenvectors (u) that will define new axes. Eigenvectors help to find points projection on plans defined by new axes, whereas eigenvalues (1 per axis) evaluate quantity of variance (or inertia) of points explained by each axis.
At the end of PCA, we can represent "observations" points in space of variables (direct representation) as well as "variables" points in space of observations (dual representation). These both representations help to detect which variables and observations are the most influent to extraction of new axex by PCA.
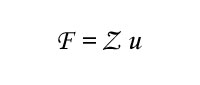
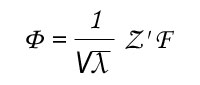
Coordinates F of observations in direct representation are calculated as follow :
Coordinates of variables indual representation are calculated as follow :
Dual representation's specificity is that variables positions in the space of observations give informations about correlation coefficients between variables.
It is also possible to change weight of variables or observations (by default = 1).
Eventually, it is possible to add some "observations" points or "variables" points (illustrative) in both representations. These points are not used to define new axes, but they are added in the representations for helping interpretation of new axes.
Nota bene : PCA realized on a same data set with differents softwares may supply different representations, some axes are inverted. There is no mistake, but the result of the way inertia matrix has been diagonalized.
In spite of differences in graphs, you can notice that related positions of points are always the sames (as well as results of correlation, contribution, quality and distance - cf. below). Indeed specificity of PCA is to proceed analysis of data, the ones compared to the others.
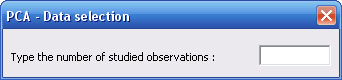
2 - Launch of Principal Components Analysis :
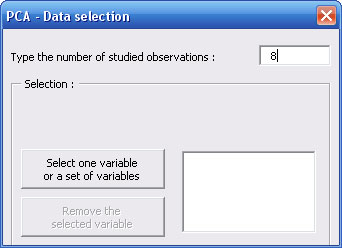
First you have to specify the number of observations.
Dialog box is revealing to show you a button allowing you to select the data set.
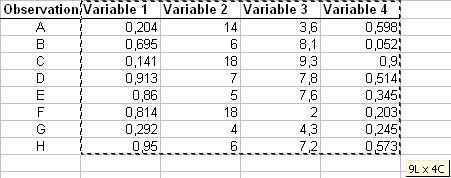
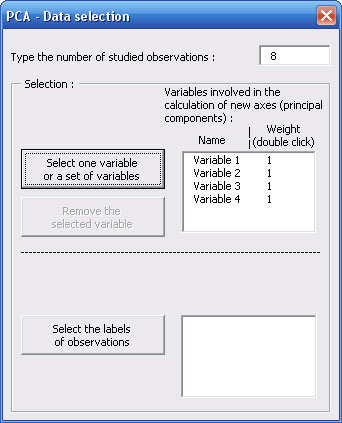
Click on this button and select variables you want to study with the name of each variable in the first cell of each column.
You can select the whole table at the same time, or if columns of your table are not contiguous, you can select it in several times always by clicking on the same button.
Variables' names appear in a list of the dialog box which is revealing again to allow you to select names of observations.
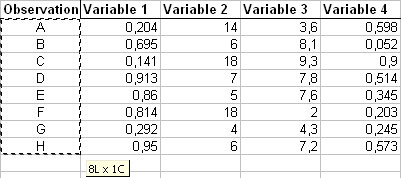
On the same way, click on the second button and select the names of observations.
Observations' names appear in the second list.
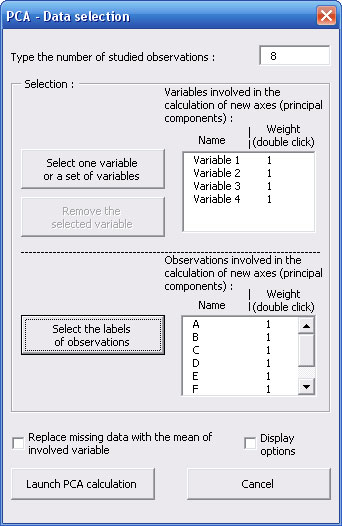
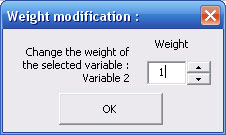
On Windows version you can notice the presence, on both lists, of a "1" column in front of each name of variable and observation : it is the weight by default. You can change a weight by double-click on it, that makes appear a new dialog box :
On the main dialog box, you can find a check box that allow you to substitute a missing data by the mean of the considered variable. By default, an observation for which a measure is missing, will be deleted from analysis.
Another check box of the main dialog box allows you to display options for :
- transformation of variables or observations as illustrative,
- realization of Hierarchical Clustering of observations.
3 - Results of Principal Components Analysis :
Results are displayed on a new Excel sheet.
Please notice that some cells have comments to explain their content (red triangle).
Details of analysis are displayed upper left of the results sheet :
- nb of variables,
- nb of observations,
- nb of factors (axes) extracted by PCA,
- nb of illustrative variables,
- nb of illustrative observations.
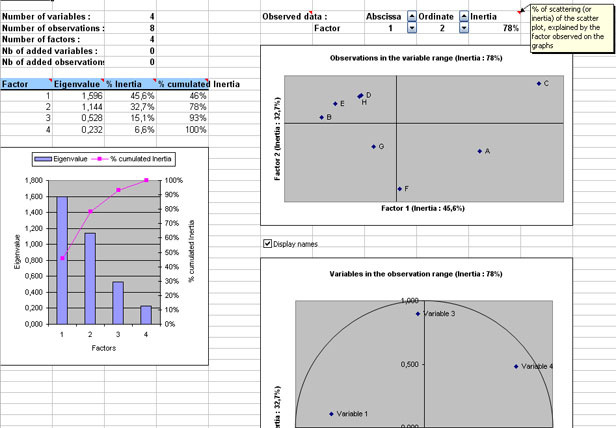
Below these recalls are displayed characteristics of new axes (or factors) of PCA, as well as a resume of them on a graph.
In the middle of the results sheet, you can see both representations : direct (of observations) and dual (of variables) according to plan composed with the 2 first factors of PCA. Please notice that above these graphs, you can change axes on representations (abscissa and ordinate) by clicking on "Up/Down arrows" (only if more than 2 factors are extracteds by PCA).
A check box allows you to display names of points on both graphical representations. Furthermore, if you specified illustrative points, a second check box allows you to visualize them on graphs.
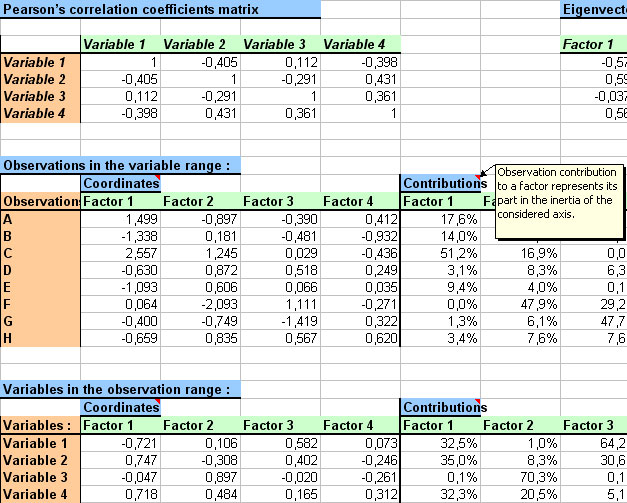
On the right part of the results sheet are displayed every numerical data necessary for PCA analysis :
- matrix of Pearson's correlation coefficients between studied variables,
- matrix of eigenvectors,
- data relative to direct representation (i.e. observations in variables space),
- les données relatives à la représentation duale (i.e. variables in observations space).
For these 2 last items, numerical data are the same :
- coordinates of points in the graphs,
- points' contributions that represent importance of each observation or variable in variance of each factor,
- qualities of representation (or cos²) that inform on angle between the line linking center of points to studied point, and the considered axis. If cos² is close to 1, it implies that this angle is close to 0 ; thus if projection of a point is close to an axis, this point will be, in space, indeed close to the axis,
- distances of observations points and variables points from center of points. Notice that variables points are all located on a sphere whose radius = 1 and the center is the center of points, whereas observations points can be anywere in space,
- inertia that expresses percentage of variance of points explained by the considered observation point or the variable point.
|