2 - Khi² test for normality :
2.1 - Principles of Khi² test :
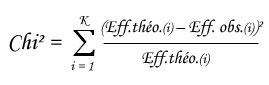
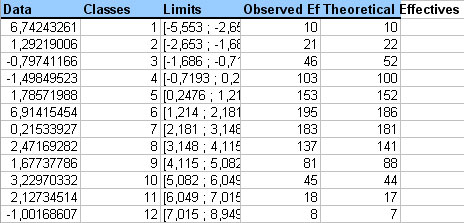
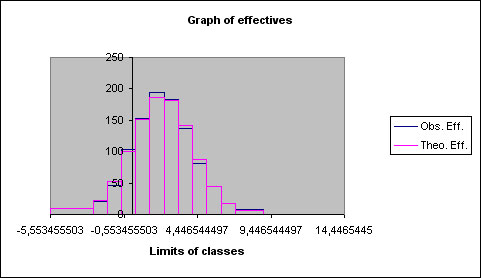
This test is made for analysis of important effectives (>50). Total effective is divided in K different classes and we compare observed effectives on each class with theoretical effectives, calculated under normality hypothesis.
Calculated Khi² is then compared to the limit value from the Khi² table.
Nota bene : classes are gathered when theoretical effectives are lower than 5 (condition to use the test). If, in spite of gathering, theoretical effectives are still lower than 5, test is not valid which is notified by a red message in the conclusions of results sheet.
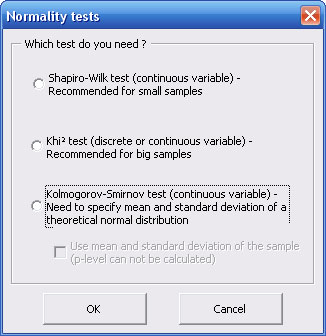
2.2 - How to use Khi² test for normality :
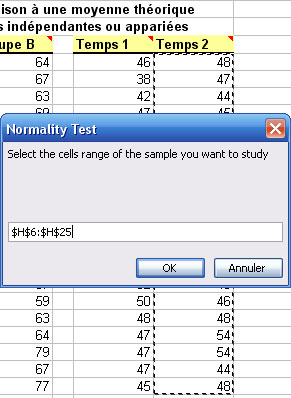
As for the Shapiro - Wilks' W test (cf. above), StatEL just requires that you select the cells range related to data whose you want to test normality distribution. To proceed the selection, you just have to clic on the first cell of your data with the mouse and to stretch until the last cell of your data.
If you did wrong, you just have to try again, new selection will erase references of previous selection.
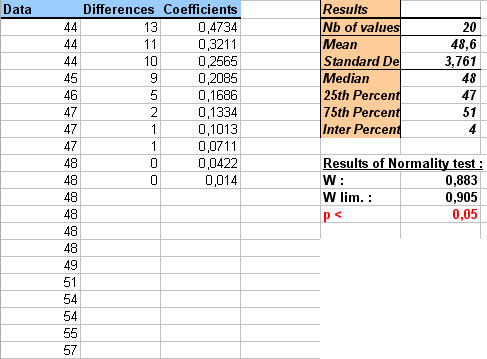
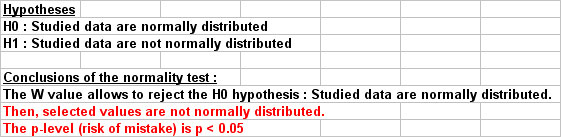
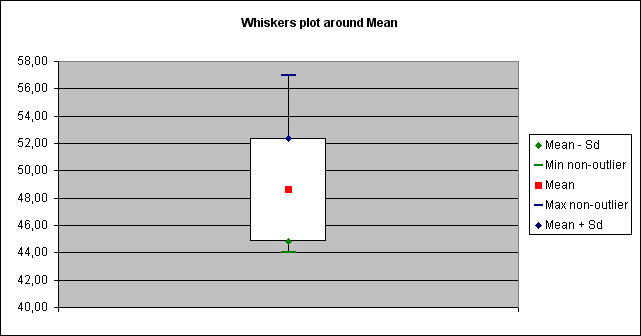
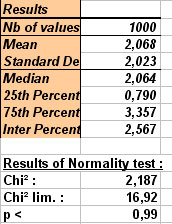
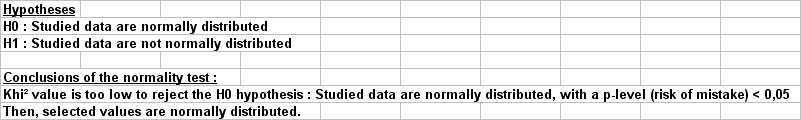
Results display on a new sheet of your Excel file :