| |
 |
StatEL : Multiple Linear Regression
|
|
|
|
| |
This command launch calculation of parameter for a linear model between a dependent variable (Y) and several independent or explicative variables, all of them are quantitative variables.
1 - Principles of Multiple Linear Regression :
Principle of least squares is the same than for simple linear regression. Only calculation methods are different since we have to use matrix calculations we will not detail.
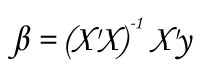
However, calculation of parameters vector is made by :
where "X" is the (n x p) matrix of data related to explicative variables (with a column of "1" for calculation of the intercept), "y" is the (p x 1) vector of data related to dependent variable, n is the number of observations and p is the number of parameters of the model.
Conditions to use the test :
- Normal distribution of each studied variable
2 - Launch of Multiple Linear Regression :
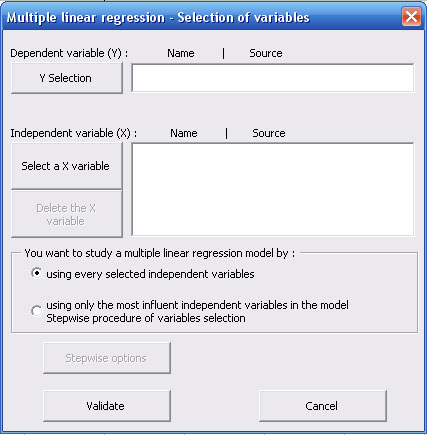
This dialog box allows you to specify which variables you want to study :
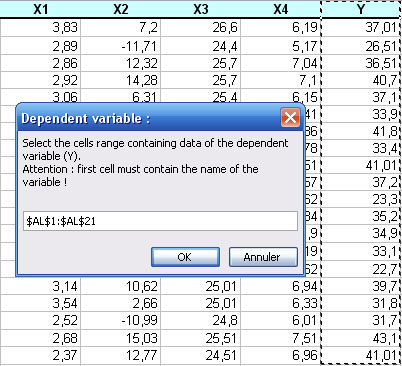
Select the dependent variable (Y) by clicking on "Select Y" button. To proceed the selection, you just have to clic on the first cell of your data with the mouse and to stretch until the last cell of your data.
Nota bene : in order to identify at the best different measures groups, first cell of each selection must contain name of the variable. These names will be used in the results sheet.
In the same way, you have to select one by one, each expicative or independent variable explicative by clicking on "Select a X variable" button. Each validation of a new sélection add its name in the list of explicative variables.
Nota bene : in a multiple linear regression analysis, number of measures is supposed to be the same for each group, since it concerns pairs of measures. However, StatEL will manage missing data if, for each group, selection is applying on exactly the same number of cells (empty or not).
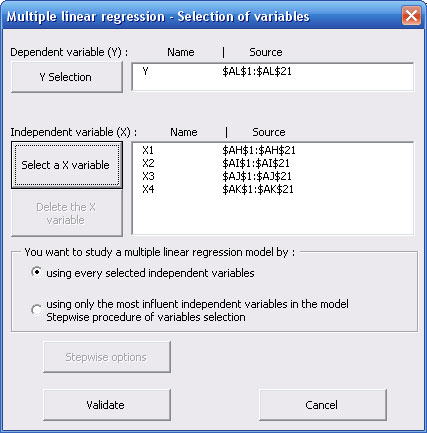
You may compute a multiple linear regression model :
- with every explicative variables you specified in the above dialog box (default option),
- with only influent explicative variables.
In this last case, calculation will follow the procedure of step by step selection of variables thanks to the Stepwise method : StatEL includes successively, in the model, the explicative variables the most influent on the dependent variable, then StatEL checks systematically if entry of a new variable in the model induces exclusion of a previously entered variable (because of colinearity between explicative variables).
Tests of entry and removal of a variable in the model are fixed with a p-value lower than 5%. However, you may want to "soften" variables' removal procedure with a p-value lower than 10%, thus you favorize entry of new variables (the most significantly influent ones), but you tolerate to maintain them, even if they become a little bit less significant.
You can change this option by clicking on "Stepwise Options" button, only accessible if you ticked the "Stepwise Method" option.
3 - Results of Multiple Linear Regression :
Results display on a new sheet of you Excel file.
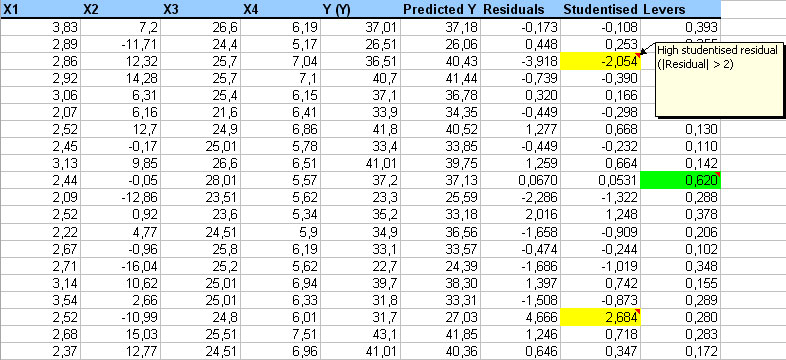
- On the left part of the results sheet are displayed on a table, selected data, calculated Y values (thanks to linear model), residuals, studentized residuals, levers of each data pair and limits of 95% confidence interval of the simple linear regression model :
Sudentized residuals with highest values (>2 ou <-2) are highlighted with yellow bacground and an associated comment ; it is the same for highest levers (in green).
- On the left part of the results sheet are successively displayed :
- table of descriptive statistics,
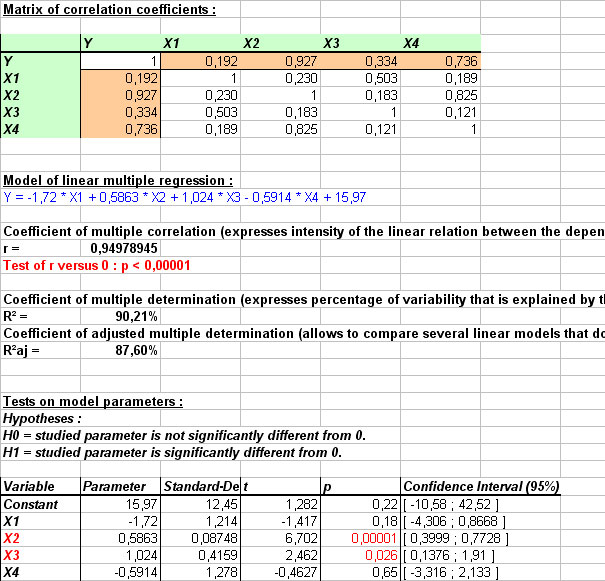
- matrix of correlation coefficients between the different variables,
- details of the stepwise procedure if you choosed this option in the first dialog box,
- the multiple linear regression model,
- correlation coefficient and multiple determination coefficient,
- the table of significativity for differents parameters of the model,
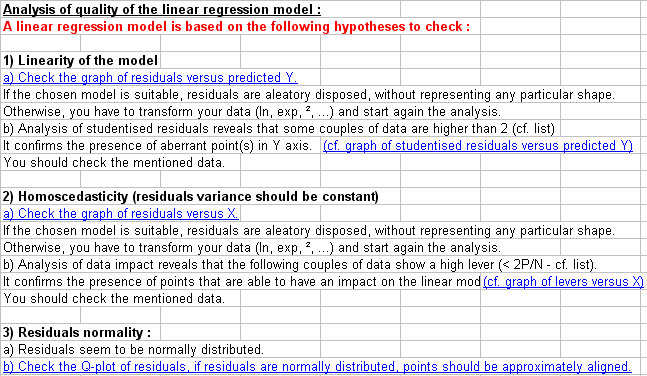
- elements to analyze quality of the multiple linear regression model : linearity of the model, variance of residuals, linearity of residuals,
- some graphs are displayed to illustrate : graph of Y = f(X) with 95% confidence interval, graph of observed Y vs calculated Y, graph of studentized residuals, graph of levers effect, Q-plot.
|
|
|
| |
|
ad Science Company - 55, Boulevard Pereire, 75017 PARIS - France
|
|
|
|