| |
This
command launches analysis procedure of a measures table (both
qualitative or quantitative
variables of a group of observations) :
1 -
Principles of Multiple Correspondence Analysis :
Graphical
representation of a measures table can be made very easily as soon as
we have very few variables : it will be plane if there is only 2
variables (one for abscissa and one for ordinate), it will be in 3
dimensions if we add a third variable. Representation is impossible if
number of variables is higher than 3, since it requires an axis to code
each variable.
Principle
of MCA is to synthesize informations contained in a measures table of
both qualitative and quantitative variables, whatever the number of
variables and observations, by detecting main tendencies of this table,
due to variables as well as observations.
MCA
allows to detect axes (= principal components) by which points spread
the most. These "synthetic" axes may result of influence of one or
several variables or observations.
Thus,
by projection of points (observations or variables) on plans defined by
these new axes, we have a representative "photograph" of points.
By
analogy, imagine someone is trying you to recognize an animal drawn on
a paper sheet (that is a camel) but you see only its face shape. You
can not conclude if it is a camel or a dromedary, just because angle of
analysis is not the most informative. You need a profile image of the
animal to conclude with certitude that it is a camel. On the same way,
PCA calculates new axes (and then plans) able to advise you at the best
about repartition of points.
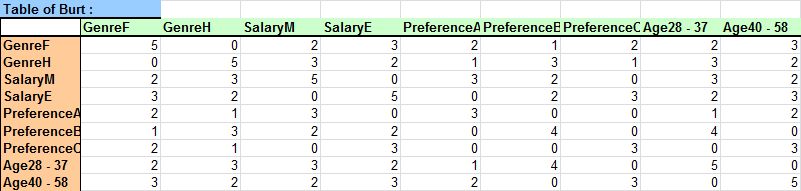
MCA
can be practiced after transformation of the table of observations in a
new type of table, containing frequencies of every modality (tabe of
Burt).
Eventually,
it is possible to add some "observations" points or "variables" points
(illustrative) in both representations. These points are not used
to define new axes, but they are added in the representations for
helping interpretation of new axes.
Nota
bene : MCA realized on a same data set with differents
softwares may supply different representations, some axes are inverted.
There is no mistake, but the result of the way inertia matrix has been
diagonalized.
In
spite of differences in graphs, you can notice that related positions
of points are always the sames (as well as results of correlation,
contribution, quality and distance - cf. below). Indeed specificity of
MCA is to proceed analysis of data, the ones compared to the others.
2 - Launch
of Multiple Correspondence Analysis :
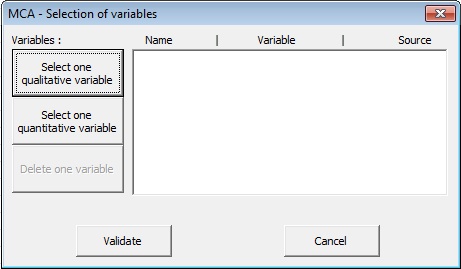
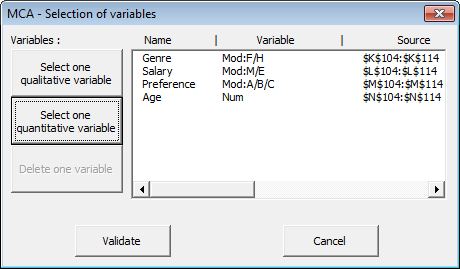
Firts
dialog box allows you to select the ddifferent variables (qualitative
or quanttative, independantly)
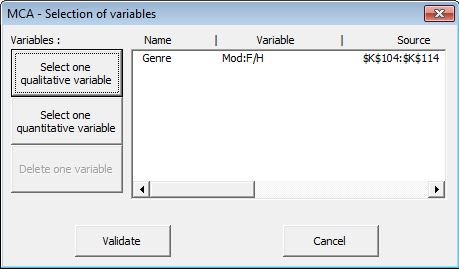
2.1
- Selection of a qualitative
variable
:
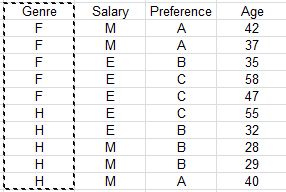
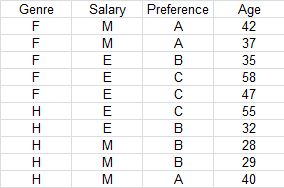
Click
on the corect button and select the range of cells containing one of
the variables that you want to analyze, with th name of the variable in
the first cell.
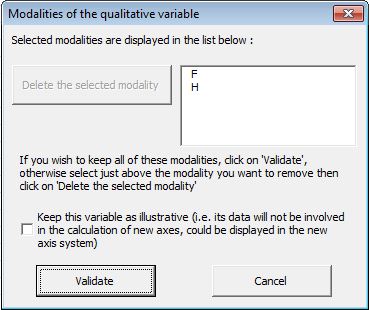
Modalities
of the selected variable appear in a new dialog box. You can delete on
or the other of the modalities, or specify this variable as
"illustrative".
Once
your choice is validated, the selected variable appeear in the list of
the first dialog box, with its specificities.
2.2
- Selection of a quantitative
variable
:
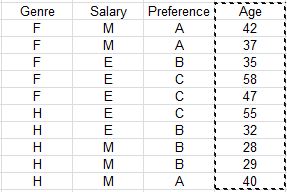
Click
on the corect button and select the range of cells containing one of
the variables that you want to analyze, with th name of the variable in
the first cell.
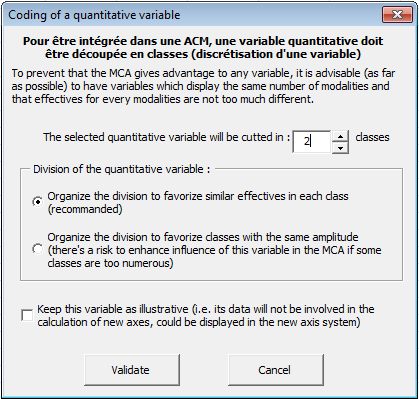
A
new dialog box allows you to specify the way you want to code the
numerical variable. You can also decide if this variable must be
considered as an illustrative variable.
Once
your choice is validated, the selected variable appeear in the list of
the first dialog box, with its specificities.
3 -
Results of
Multiple Correspondence Analysis :
Results
are displayed on a new Excel sheet.
Please
notice that some cells have comments to explain their content (red
triangle).
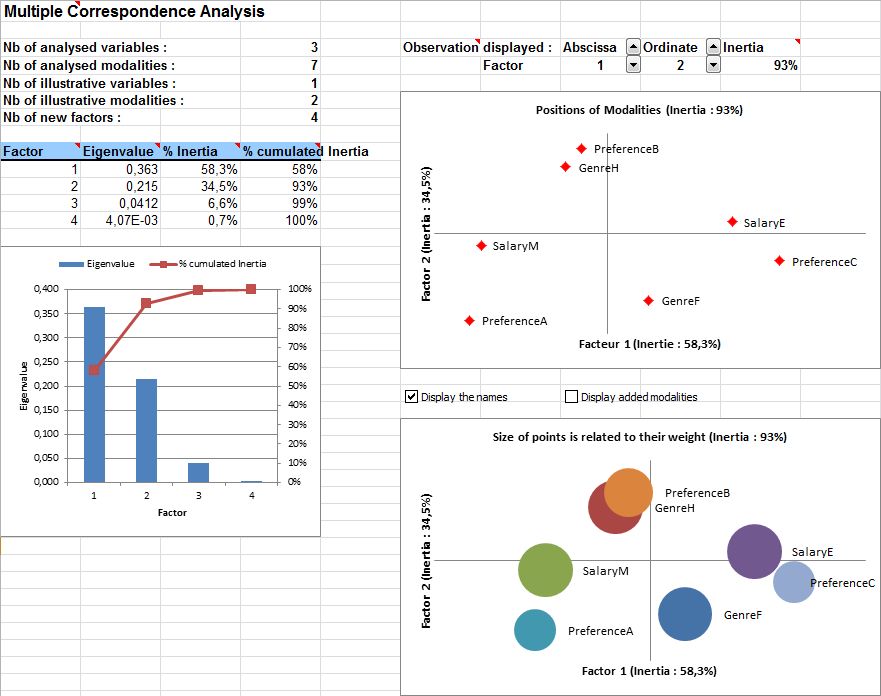
Details
of analysis are displayed upper left of the results sheet :
- nb
of analysed variables,
- nb
of analysed
modalities,
- nb
of illustrative
variables,
- nb
of illustrative
modalities),
- nb
of new axis extractes by MCA.
Below
these recalls are displayed characteristics of new axes (or factors) of
MCA, as well as a resume of them on a graph.
In
the middle of the results sheet, you can see both representations :
- graph
représenting relative positions
of
modalities of the different variables,
- graph
représenting relative positions
of
modalities,
and the weight of every modality (sum of every row or column of the
table of Burt).
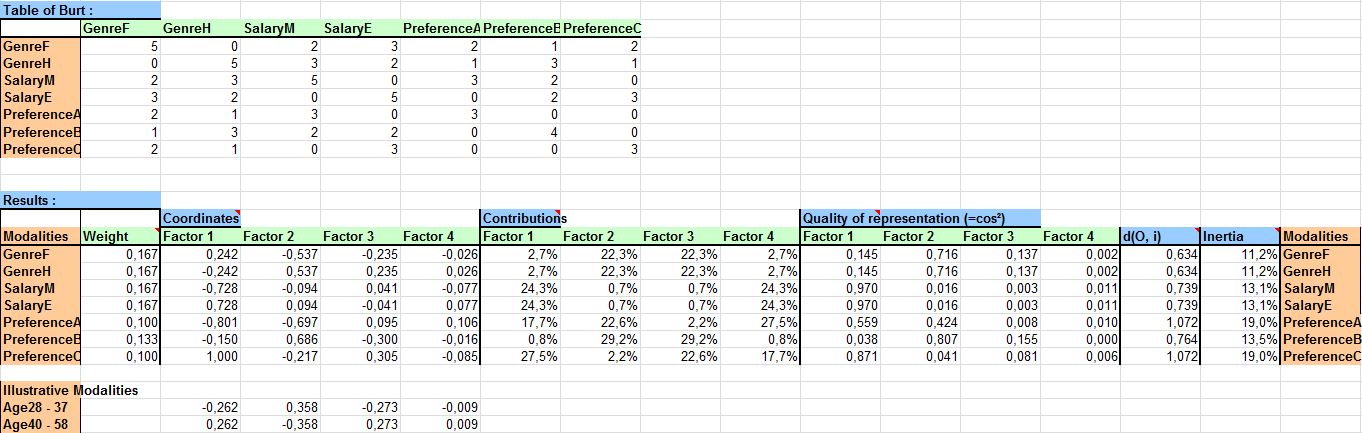
On
the right part of the results sheet are displayed every numerical data
necessary for MCA analysis :
- the
table of Burt,
- data
telated to graphical representations :
- relative
weights of every modality,
- coordinates
of points in the graphs,
- points'
contributions that represent importance of each observation or variable
in variance of each factor,
- qualities
of representation (or cos²) that inform on angle between the line
linking center of points to studied point, and the considered axis. If
cos² is close to 1, it implies that this angle is close to 0 ; thus if
projection of a point is close to an axis, this point will be, in
space, indeed close to the axis,
- distances
of observations points and variables points from center of points.
Notice that variables points are all located on a sphere whose radius =
1 and the center is the center of points, whereas observations points
can be anywere in space,
- inertia
that expresses percentage of variance of points explained by the
considered observation point or the variable point.
|