| |
 |
StatEL : Logistic Regression
|
|
|
|
| |
Logistic regession is practiced to detect relationship between a binary dependent variable (Y = 0 or 1) and one or several independent variables, either quantitative (= numerical) or qualitative (= categorical).
Qualitative independent variables (also called covariates) can be binary (or dichotomous, 2 modalities only) or polytomous (3 or more modalities), and secondly they can be ordinal (order of modalities has a signification, ex : little/medium/big) or not.
Example (in Hosmer & Lemeshow) :
Low birth weight is harmful to chidren's growing, so a study was undertaken to evaluate riks of Low Birth Weignt (Y variable). Among 8 potential risk factors (independent variables), Authors of this study decided to keep the 4 following variables :
- 2 quantitative variables : age of the mother (AGE) and its weight et last menstrual period (LWT),
- 2 qualitative variables : number of first trimester physician visits (FTV) and race of the mother (RACE coded in 3 categories).
Parameters of the model are calculated through method of generalized least squares, each coefficient is analysed through test of Wald, and significance of the model is evaluated through method of maximum likelihood.
1 - Principles of logistic regression :
1.1. Choice of the model of logistic regression
When dependent variable (Y) is quantitative, hypothesis of normality for its distribution is realistic, which is not the case when Y is a qualitative vairable, since its values are limited to some modalities (0 and 1 for binomial variables) :
Y = f(X)
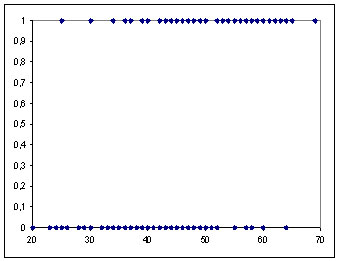
In this case, analysis of a regression model for a qualitative variable consists in calculation of probability for Y variable Y to take any modality. Ex : in the relationship between the probability of a binary dependent variable (Y) and an quantitative independent variable (X), we observe a "S" shaped curve (sigmoidal relationship), limited between 0 and 1 :
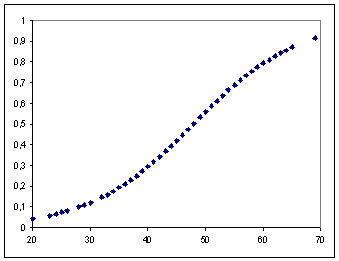
Probability (Y=1) according to values of X
It is easy to understand that if we try to modelize these points with a linear regression model, this one will exceed limits of 0 and 1 (which is not conceivable). This curve most adapted model is the logistic distribution function, we talk about "logit" or logistic model.
Note : the "probit" model can also modelize a probabiliy, however the "logit" model allows to use Odds Ratio values (cf. below) which quantify the risk to have a positive outcome (Y=1) according to any modality of a qualitative independent variable, or according to increase of 1 unit of a quantitative independent variable.
1.2. Estimation of the logistic regression model
To find the best fitting model to describe the relationship between on binary dependent variable and k covariates, the k coeficients of the logistic regression model are calculated through the Maximum Likelihood method.
Significance of the k calculated coefficients (b1, b2, ..., bk) are tested through test of Wald (W) :
- H0: bk coefficient is not significantly different from 0
- H1: bk coefficient is significantly different from 0
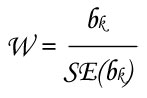
with :
- bk estimation of the coefficient for the kth covariate
- SE(bk) standard error of the coefficient for the kth covariate
This value follows the standard normal distribution.
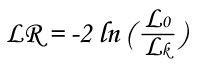
The significance of the complete model is evaluated with Likelihood Ratio test :
- H0: no coefficient of the logistic regression model is significantly different from 0
- H1: there is one coefficient of the logistic regression model whose value is significantly different from 0
with :
- L0 likelihood of the logistic regression model without covariates (i.e. only intercept)
- Lk likelihood of the logistic regression model with all covariates
This value follows the Khi² distribution.
1.3. Advantage of the "Logit" model : Odds Ratio
The Odds Ratio (OR) is a measure of association. It shows how much more likely or unlikely it is for the outcome (Y=1) to be true when X=1 than when X=0.
Example : if Y variable shows the presence (Y=1) or absence (Y=0) of a disease for subjects which are (X=1) or not (X=0) exposed to a risk factor (ex : subjects are smokers or not). P1 is the probability to have the disease if subject is exposed to the risk and P0 is the probability to have the disease if subject is not exposed to the risk. OR is calculated as follow :
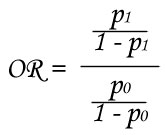
If OR is higher than 1, it means that disease is more likely for subjects which are exposed to the risk factor. On the contrary, if OR is lower than 1, it means that disease is more unlikely for subjects which are exposed to the risk factor.
Furthermore, value of this OR measures how much the risk is likely or unlikely. Thus, OR = 2 means that risk to have Y=1 is twice for subjects with X=1 compared to subjects with X=0.
With a logistic regression model, the odds ratio are directely calculated from the coefficients of covariates: OR = exp(coefficient).
1.4. Case of binary covariates in a logistic regression model
A binary (or dichotomous) covariate shows only 2 modalities (male/female, success/failure, healthy/disease...). Nevertheles, for calculations of coefficients of a logistic regression model, the 2 modalities must be changed in 0/1. You have to choose which modality should be encoded in "1", considering that conclusions issued from odds ratio values are related to this modality. In other words, modality encoded in "0" is the reference compared to modality encoded in "1". During the data selection procedure, StatEL allows you to specify which modality must be encoded in "1" and in "0".
1.5. Case of polytomous covariates in a logistic regression model
A polytomous covariate can show 3 (or more) different modalities. However, for calculations of coefficients of a logistic regression model, the modalities must be changed in numerical values. You can directely encode each modality ("0" for the first modality, "1" for the second modality, "2" for the third modality, etc...).
During the data selection procedure, StatEL allows you to specify the way each modality must be encoded. Nevertheles, in this situation, odds ratio measures the risk to have Y=1 when subjects show any modality compared to subjects who show the modality encoded in "0", without any other precision. Thus, in this way, information of modalities encoded in "1", "2", "3", ... is not fully exploited.
Nevertheles, there is another encoding method of a polytomous covariate that allows to calculate as many odds ratio as number of modalities (minus one : the reference modality), and thus to extract information of every modalities for this covariate. It consists in creation of new covariates: the "design variables", each one shows one modality of the initial polytomous covariate and is encoded in "0/1" (cf. below).
a) Coding of a polytomous variable in design variables:
Coding of a polytomous variable in design variables requires to choose which modality will be a "reference" compared to the others. Considering a qualitative variable with 4 modalities "A", "B", "C", "D". The last modality is the reference compared to the 3 others. Transformation of this polytomous variable leads to constitution of 3 new design variables, eash one is related to the 3 modalities, and encoded in "0/1" as follow :
| Polytomous variable |
design var. 1
|
design var. 2
|
design var. 3
|
|
A
|
1
|
0
|
0
|
|
B
|
0
|
1
|
0
|
|
C
|
0
|
0
|
1
|
|
D
|
0
|
0
|
0
|
Consequently, the logistic regression model contains 3 binary covariates instead of one polytomous covariate with 4 modalities. Each covariate has a coefficient whose exponential measures its odds ratio. Thus, according to example above, if the design variable N°1 has a coefficient b = 0.69, its odds ratio = 2 (= e0.69). It means that the risk to have Y=1 is twice as often among subjects that show modality "A" than among subjects that show modality "D".
During the data selection procedure, StatEL manages creation of these design variables since you specify to do it. Besides coefficients and their significance, StatEL calculates their odds ratio as well as 95% confidence interval.
b) Coding of an ordinal variable in design variables:
Coding of an ordinal variable in design variables requires to choose which modality will be a "reference" compared to the others. Considering a qualitative variable that lists size of tumors for a group of patients, the modalities of this variable are : "no tumor", "little tumor", "medium tumor" and "big tumor". The first modality is the reference compared to the 3 others. Transformation of this polytomous variable leads to constitution of 3 new design variables, eash one is related to the 3 modalities, and encoded in "0/1" as follow :
| Ordinal variable |
design var. 1
|
design var. 2
|
design var. 3
|
| none (reference) |
0
|
0
|
0
|
| little tumor |
1
|
0
|
0
|
| medium tumor |
1
|
1
|
0
|
| big tumor |
1
|
1
|
1
|
Consequently, the logistic regression model contains 3 binary covariates instead of one polytomous covariate with 4 modalities. Each covariate has a coefficient whose exponential measures its odds ratio. Thus, according to example above, imagine results of the logistic regression model : Y = 0.5 VD1 + 1.3 VD2 + 2 VD3 + intercept
Coefficients of the 3 design variables are respectively b1 = 0.5, b2 = 1.3 et b3 = 2 ; associated odds ratio (exponential of each coefficient) are respectively "1.6", "3.7" and "7.4". It means that, compared to reference modality, risk to have Y=1 is 1.6 time more important for subjects who have a "little tumor", 3.7 times more important for subjects who have a "medium tumor", and 7.4 time more important for subjects who have a "big tumor". However, calculation of the risk between 2 modalities (ex : from "little tumor" to "medium tumor") is less direct and is made according to this formula : OR(1->2) = e(b2 - b1) = e(1.3 - 0.5) = 2.23
During the data selection procedure, StatEL manages creation of these design variables since you specify to do it. Besides coefficients and their significance, StatEL calculates their odds ratio as well as 95% confidence interval.
1.6. Case of numerical covariates in a logistic regression modele
A numerical variable measures a continuous quantitative parameter. Data of such a variable (X) are included in the algorithm of calculation without any transformation. Odds ratio [exp(coefficient)] associated to this variable shows the risk to have Y=1 with augmentation of 1 unit for the X variable.
Consequently, if the numerical variable measures time in years, you could be interested in calculating the risk associated to 10 years augmentation instead of 1 year augmentation. This odds ratio is calculated through this formula : OR = e(b x 10)
2 - Launch of logistic regression:
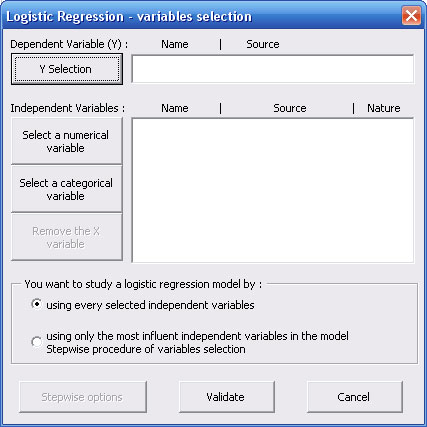
The main dialog box allows you to select :
- the dependent Y variable,
- any numerical independent variable,
- any categorical independent variable :
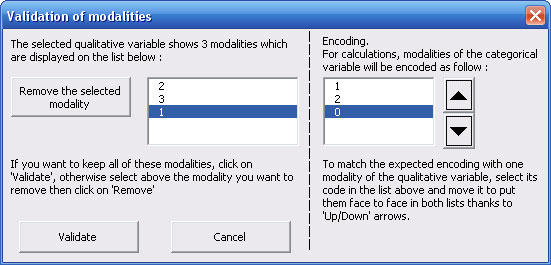
2.1. Selection of the dependent variable in the procedure of logistic regression with StatEL
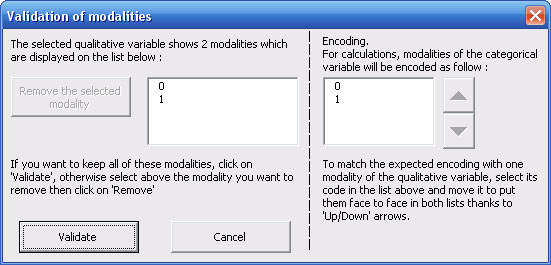
After selection of the cells range containing data for the Y variable, StatEL lists the content of this variable :
With this dialog box, you can remove one of the modalities. Furthermore, StatEL propose a default encoding in the list at the right part of the dialog box. You can move each code after selecting it (in the right list) by clicking on the "Up/Down" arrows, in order to place it in front of the expected modality (in the left list). Then you have to validate your selection.
2.2. Selection of a numerical independent variable in the procedure of logistic regression with StatEL
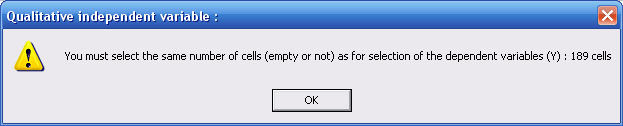
After selection of the cells range containing data for the independent variable, StatEL checks if your selection contains exactely the same number of cells as for selection of the dependent variable. If not, an error message is displayed :
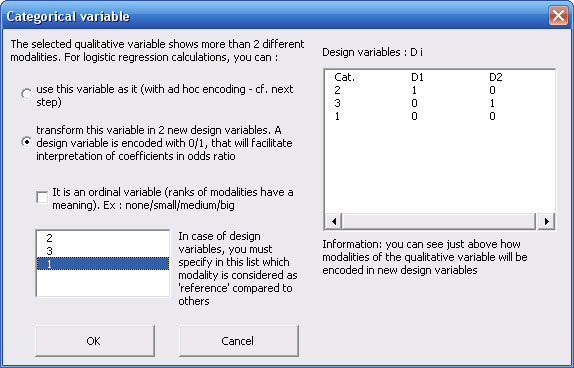
2.3. Selection of a polytomous categorical independent variable in the procedure of logistic regression with StatEL
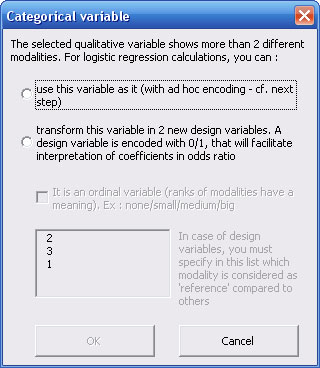
After selection of the cells range containing data for the polytomous independent variable (more than 2 modalities), StatEL lists the content of this variable and allows you to specify the way you want to encode modalities of this variable :
a) Direct encoding of a polytomous variable :
Choose the upper option, the label of "OK" button changes in "Next step >>". Click on it to go to content validation step :
In the above example, rank of encoding has been changed to place the code "0" in front of modality "1", the code "1" in front of modality "2", the code "2" in front of modality "3". Then you have to validate your selection.
b) Encoding of a polytomous variable in design variables :
Choose the second option. The lower list activates in order to select the reference modality compared to the others. Since, the dialog box widens to inform you about the encoding way for design variables:
Click on the "OK" button. A message allows you to confirm the choice of reference modality.
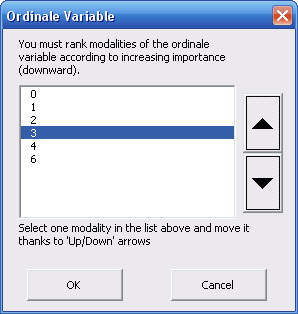
c) Encoding of an ordinal variable in design variables :
Choose the second option and tick that allows to specify it is an ordinal variable. Then you see a new dialog box in which you can change ranks of each modality :
Click on the "OK" button to validate order of modalities of the ordinal variable and come back to the previous dialog box in order to specify the reference modality. Click on the "OK" button. A message allows you to confirm the choice of reference modality.
When every variables are selected, you just have to click on the "Validate" button in order to launch the calculation procedure. If necessary, tick first option of Stepwise method for the selection of variables.
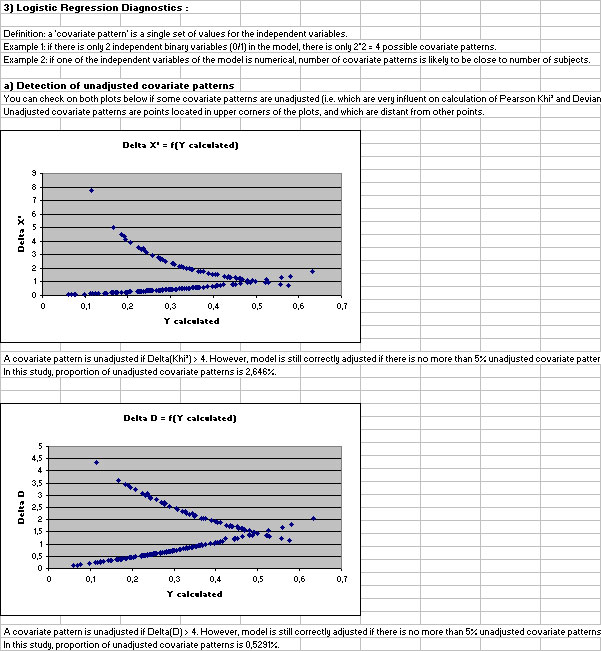
3 - Results of logistic regression:
Results display on a new sheet of you Excel file. Please note that some cells contains also comments :
In the left part are displayed the selected data, expected values of Y variable, les residuals, standardized residuals, levers and other date required for diagnostic analysis of the logistic regression model.
On the right part of the results sheet :
- descriptive statistics for each independent variable,
- the logistic regression model,
- significance analysis of every coefficients of the model with test of Wald, as well as associated odds ratio and their 95% confidence interval,
- significance analysis of the model with test of likelihood ratio,
- tests of Pearson's Khi², deviance and Hosmer & Lemeshow,
- plots of residuals and levers of different "covariate patterns".
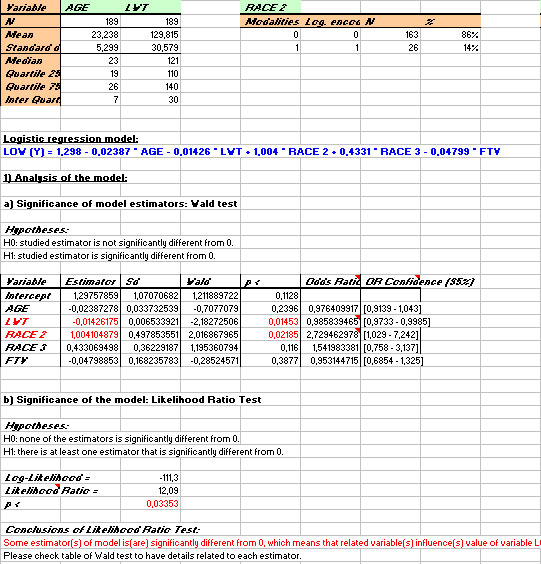
In this example (in Hosmer & Lemeshow), the test of likelihood ratio shows that the calculated model contains at least one variable whose coefficient is significantely different from 0 (with a p-value < 0.0335). The test of Wald (table) on every coefficients show that only variables LWT (p < 0.0145) and RACE 2 (p < 0.0219) have an influence on value of the Y variable.
Their odds ratio are also significant (with a p-value < 0.05) since their 95% confidence intervals exclude the value 1. We conclude that the risk to give birth to low weight children is multiplicated by 0.9858 when the weight of the mother increases of 1 unit (by extension, we can calculate that this risk is multiplicated by e(10 x -0.01426) = 0.867 when the weight of the mother increases of 10 units). Fruthermore, the risk to give birth to low weight children is multiplicated by 2.729 for mothers who belong to category RACE 2 compared to those belonging to reference category (RACE 1).
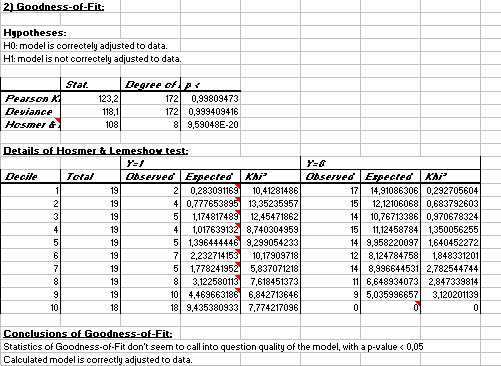
In this same example, the Pearson's Khi² test and the deviance test do not reject goodness of fit hypothesis. The test of Hosmer & Lemeshow suggests rejection goodness of fit hypothesis. Nevertheless, the associated comment recalls that powerful of this statistic is reduced when these conditions are not respected : N > 400 and estimated frequencies > 5 (cf. table of H&L). Since none of these conditions is respected, we shall not trus result of this statistic.
|
|
|
| |
|
ad Science Company - 55, Boulevard Pereire, 75017 PARIS - France
|
|
|
|