| |
This command launches analysis procedure of a qualitative variable with K modalities, evaluated on N observations, according to P quantitative variables measured on this sample :
1 - Principle of Discriminant Analysis :
DA has 2 goals :
- to identify quantitative variables that allow to split a population in several sub-groups (each one is characterized by a modality of the qualitative variable),
- to classify a new observation in one of the specified sub-groups, thanks to its measures for the same quantitative variables.
DA allows to detect axes (due to one or several quantitative variables) that induce the best separation between the different sub-groups.
Thus, by projection of points (observations) on plans defined by these new axes, we have a "photograph" of all points that shows the best separation of sub-groups.
Calculation must identify axes that will minimize variance inside sub-groups (within-groups variance) in order to gather the most homogeneous observations, and that will maximize variance between sub-groups (between-groups variance).
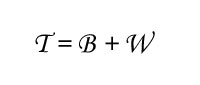
On a technical way, several calculation formulas are possible (according to the used "Metric"), but we always have to proceed diagonalisation of inertia matrix :
- T is the total inertia matrix,
- B is the between-groups inertia matrix,
- W is the within-groups inertia matrix,
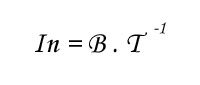
Diagonalise of the matrix induced by this calculation :
After diagonalisation of this matrix, we extract the K - 1 (or P - 1 if P < K) eigenvalues (x) and matrix of eigenvectors that will define new axes. Eigenvectors help to find points projection on plans defined by new axes, whereas eigenvalues (1 per axis) evaluate discriminant ability of each axis. In particular, if discriminant ability of first axis is 1, this axis allows to separate completely every sub-groups. If eigenvalue is lower than 1, separation is possible, but incomplete.
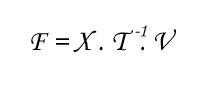
Coordinates of observations are calculated with :
- X matrix of standardized data,
- T matrix of total variance,
- V matrix of eigenvectors :
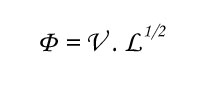
Coordinates of variables are calculated with :
- V matrix of eigenvectors,
- L diagonal matrix of eigenvalues :
2 - Launch of Discriminant Analysis :
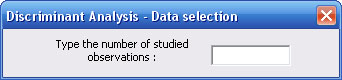
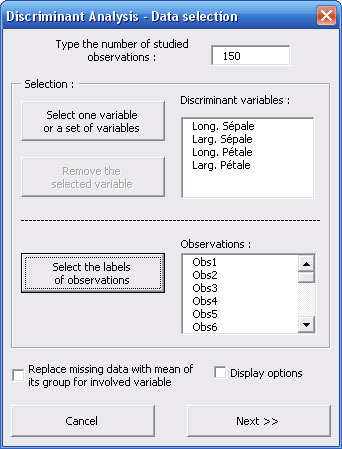
First you have to specify the number of observations.
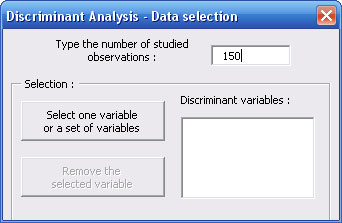
Dialog box is revealing to show you a button allowing you to select the data set.
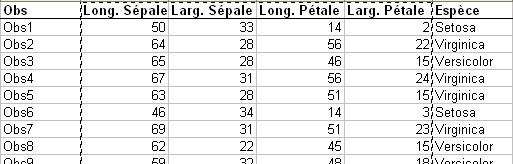
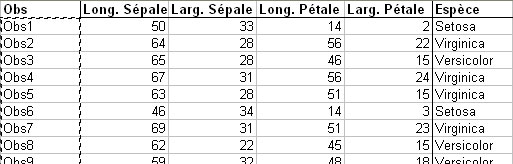
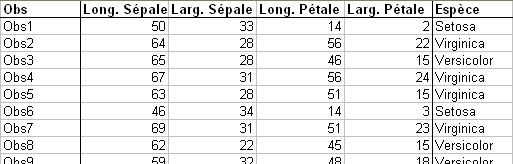
Click on this button and select variables you want to study with the name of each variable in the first cell of each column.
You can select the whole table at the same time, or if columns of your table are not contiguous, you can select it in several times always by clicking on the same button.
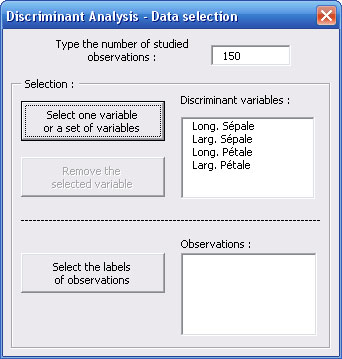
Variables' names appear in a list of the dialog box which is revealing again to allow you to select names of observations.
On the same way, click on the second button and select the names of observations.
Observations' names appear in the second list.
On the dialog box, you can find a check box that allow you to substitute a missing data by the mean of the considered variable. By default, an observation for which a measure is missing, will be deleted from analysis.
The "Display options" checkbox allows you to select observations that are illustrative, i.e. observations that you do not know how to classify.
Then you can carry on selection procedure by clicking on "Next >>" button.
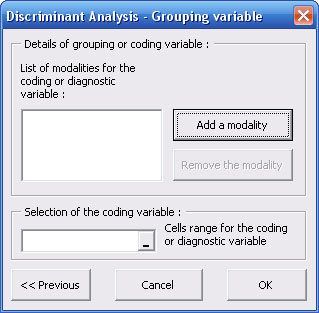
A new dialog box allows you to specify characteristics of the qualitative variable :
Click on "Add a modality" button to specify each modality of the qualitative variable.
At last, you have to select the cells range related to the qualitative variable :
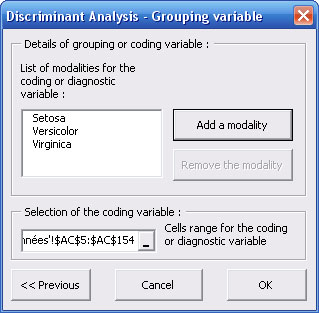
Validate your choices by clicking on "OK" button.
3 - Results of Discriminante Analysis :
Results are displayed on a new Excel sheet.
Please notice that some cells have comments to explain their content (red triangle).
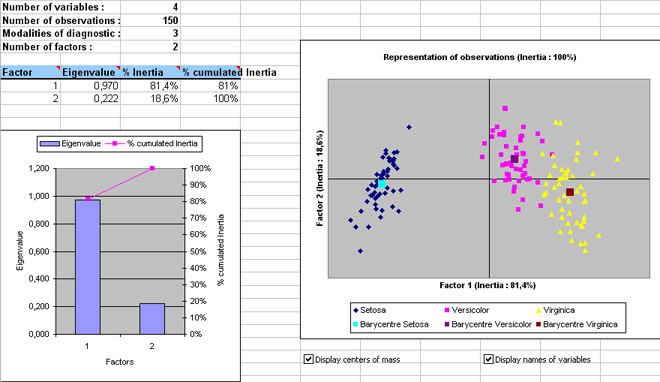
Details of analysis are displayed upper left of the results sheet :
- nb of variables,
- nb of observations,
- nb of modalities of the qualitative variable,
- nb of factors (axes) extracted by DA.
Below these recalls are displayed characteristics of new axes (or factors) of DA, as well as a resume of them on a graph.
In the middle of the results sheet, you can see both representations : direct (of observations) and dual (of variables) according to plan composed with the 2 first factors of DA. Please notice that above these graphs, you can change axes on representations (abscissa and ordinate) by clicking on "Up/Down arrows" (only if more than 2 factors are extracteds by DA).
A check box allows you to display names of points on both graphical representations. Furthermore, if you specified illustrative points, a second check box allows you to visualize them on graphs.
On the right part of the results sheet are displayed every numerical data necessary for DA analysis :
- results of descriptive statistics for each variable and each group,
- matrix of Pearson's correlation coefficients between studied variables,
- coordinates of variables in the new system of axes,
- matrix of eigenvectors,
- matrix of
- total variance ,
- between-groups variance,
- within-groups variance,
- characteristics of observations.
For this last item, informations are :
- diagnosis :
- a priori, it is the classification of observations specified before DA (reference classification),
- a posteriori according to geometrical method, it is a classification of observations due to DA ; this method classes an observation in the group whose the center of gravity is the closest,
- a posteriori according to probabilistic method, it is a classification of observations due to DA ; this method classes an observation in the group whose the probability of belonging is the highest,
- distances of each observation with center of gravity of each group ; this information is used for a posteriori classification according to geometrical method,
- probabilities of belonging of each observation to groups ;this information is used for a posteriori classification according to probabilistic method,
- coordinates of each observation in the new system of axes.
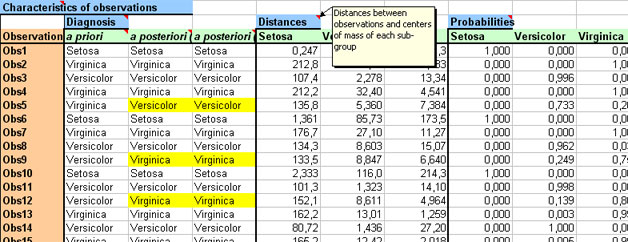
Nota bene : a reclassified observation is highlighted by a colored cell.
If you specified som observations as illustrative, these ones are then listed with their belonging group according to both methods (geometrical and probabilistic).
At last, 2 last tables evaluate quality of classification with DA by calculating percentage of observations correctly reclassified by DA.
|