| |
StatEL allows you to calculate intensity of concordance between 2 estimators for evaluation of qualitative (Kappa coefficient), quantitative or ordinal (Kendall coefficient of concordance) variables.
Test of concordance should be used to evaluate how much 2 estimators (i.e. 2 observators who judge the same observations, or 2 devices that measure the same parameter on the same observations) are concordant. This test consists in distinguishing real concordances between 2 estimators those that occurs only by chance.
1 - Qualitative Parameter / Kappa Coefficient :
1.1 - Principle of Kappa test :
The nonparametric test of Kappa allows to quantify the agreement between 2 estimators when it concerns a qualitative parameter. The agreement is defined as the accordance of 2 informations about a same object. This notion implies existence of a link between variables, requires same kind of variables and a matching of judgments.

With Po observed proportion of concordance, and Pa expected proportion of concordance.
This formule for calculation of Kappa is valid when qualitative parameter has not more than 2 modalities. In case of more than 2 modalities, formula is different to take into account importance of discordance between the both estimators (example : in case of diagnosis about patients, a disagreement such as "stable health /improved health" is less grave than a disagreement such as "aggravate health /improved health". In this case, calcul of Kappa is made with observed and expected proportions of discordance, with a weighted coefficient.
1.2 - Utilization of Kappa test :
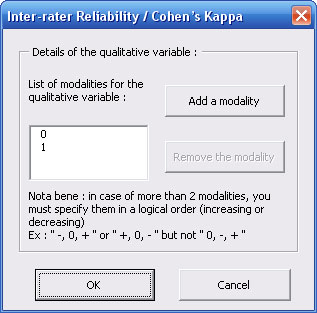
- First, StatEL needs you to specify modalities of the quantitative parameter evaluated by 2 estimators :

By default, modalities of the coding variable are "0" and "1". You can remove them by selecting them in the "List of modalities" and by clicking on the "Remove the modality" button. Then, specify one by one each modality of the coding a variable by clicking on "Add a modality".
Nota bene : if there is more than 2 modalities, it is necessary to classify them in a logical order (increasing or decreasing order).
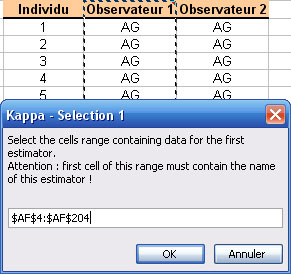
- Then, you have to successively select the cells range related to observations of both estimators. To proceed the selection, you just have to clic on the first cell of your data with the mouse and to stretch until the last cell of your data.
Nota bene : in order to identify at the best different measures groups, first cell of each selection must contain name of the group. These names will be used in the results sheet.

Nota bene : in Kappa test, number of measures is supposed to be the same for each group, since it concerns pairs of measures. However, StatEL will manage missing data if, for each group, selection is applying on exactly the same number of cells (empty or not).
Nota bene : l'ordre des individus évalués par l'estimateur N°1 doit bien évidemment être le même que l'ordre des individus évalués par l'estimateur N°2.
1.3 - Results Kappa test :
Results display on a new sheet of you Excel file :
- At last, a graph displays repartitions of observations of estimator N°2 according to observations of estimator N°1.
2 - Quantitative or Ordinal Parameter : Kendall Coefficient of Concordance :
2.1 - Principle of Kendall test :
The nonparametric test of Kendall allows to quantify the agreement between 2 estimators when it concerns a quantitative or ordinal parameter.
This test requires to calculate rank of quantitative data, for each of both estimators. In case of ordinal parameter, ranks are already calculated. Then, data are classified according to increasing order of one of both estimators (ex : A). Concerning the other estimator (B), we calculate the sum of pairs that appear in a coherent order (+1) and those that appear in an incoherent order (-1).
Calculation of Kendall coefficient of concordance is the ratio of this sum and the total number of different paris for N objects (T = N*(N-1)/2).
Note : calculation is modified in case of ex-aequo.
2.2 - Utilization of Kendall test :
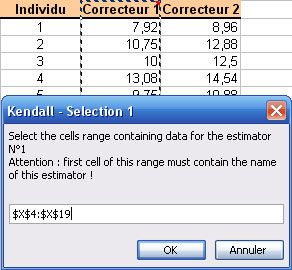
StatEL needs you to successively select the cells range related to observations of both estimators. To proceed the selection, you just have to clic on the first cell of your data with the mouse and to stretch until the last cell of your data.
Nota bene : in order to identify at the best different measures groups, first cell of each selection must contain name of the group. These names will be used in the results sheet.

Nota bene : in Kendall test, number of measures is supposed to be the same for each group, since it concerns pairs of measures. However, StatEL will manage missing data if, for each group, selection is applying on exactly the same number of cells (empty or not).
2.3 - Results of Kendall test :
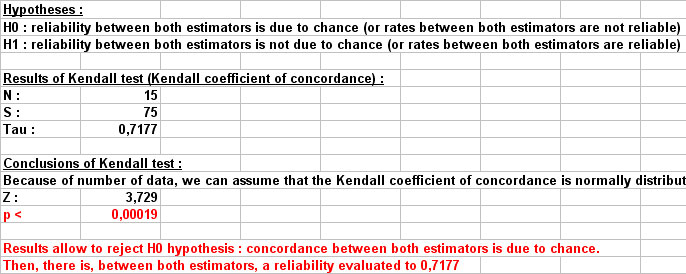
Results display on a new sheet of you Excel file.
On the left part of the sheet, you can see table of selected data, with transformation in ranks des données quantitatives, and classification of the whole data according to increasing order of first estimator.
On the right part of the sheet are displayed table of descriptive statistics, tested hypotheses, results of Kendall calculations, and Kendall conclusions.

At last, a graph displays repartition of observations for both estimators, the linear regression model for these points and the line Y = X, characteristic of a perfect concordance.
|