| |
 |
StatEL : Comparison of 3 or more Survival studies - Heterogeneity test
|
|
|
|
| |
This command allows comparison of 3 or more survival curves with heterogeneity test through actuarial method or Kaplan-Meier's method :
- actuarial method is preferable when studied effectives are important because it divides total duration of the study in constant intervals and calculate survival probability at the end of each interval,
- Kaplan-Meier's method is preferable when studied effectives are low because it takes into account every death to draw them on the curve and to induce a new level, so curve will be diffcult to interpret if there is a lot of death.
1 - Principle of comparison of survival studies by heterogeneity test :
Interest of evaluation of a survival curve is to can compare it with another curve in order to evaluate survival probability induced by 2 medical treatments, by example.
Logrank test allows this kind of comparison :
- "H0 = survival probabilities between the K populations are the same"
- "H1 = survival probabilities between the K populations are different".
A survival study takes into account :
- the number of subjects that integrate the study (whatever the date of their entry),
- the number of subjects that are deceased during the study,
- the number of subjects that disappear from the study because they are lost, or they deceased because of another reason than the studied pathology : we speak about "censored" subjects.
For each subject, we have to know :
- their dates of entry and release from the study, or duration during which subject was maintained in the study,
- the reason or event that led to its release from survival study (dead, censored) .
Data format may be :
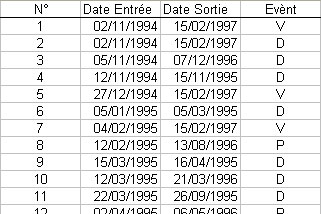
- either "Date of entry / Date of release" :
Nota bene : in this case, cells must be at "Date" format (cf. "Menu Format / Cell from Excel".
2 - Launch of heterogeneity test for comparison of survival studies :
You must first specify the method you want to analyse survival study (actuarial or Kaplan-Meier).
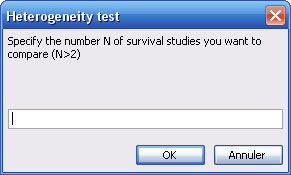
A new dialog box ask you to specify the number K of studies to compare.
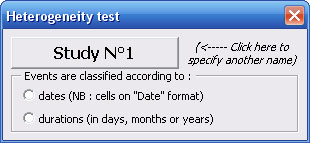
Next dialog box allows you to specify informations relative to both survival studies, whatever their data format. You just have to choose right option corresponding to data format for each study.
Nota bene : you can change name of study by clicking on "Study N°1" button and by typing the right name in the appearing dialog box or by selecting the cell that contains its name.
Nota bene : you can compare studies with different data formats.
Nota bene : if some survival studies are at the "Study Duration" format, they may have different time units.
Nota bene : if one of the survival studies does not contains any death, you have to tick the checkbox in the 'Event Variable ' frame of the dialog box. If you forget it, you will see an error message to warn you that code for death event is unfindable in the 'Event variable' selection.
As one goes along, dialog box appears progressively.
2.1 - "Date of entry / Date of release" Format :
You have to select separately the cells range relative to dates of entry and realease of patients. You also have to select the cells range relative to events that justify release of patients from the study, as well as the code for "Death" event in this cells range ("D" in our exemple).
Nota bene : every cells range selections must contain the same number of cells, if not, an error message will display.
Nota bene : if the code you specified to define "Death" event is not found in the "Event" variable selection, an error message will display.
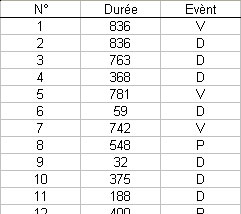
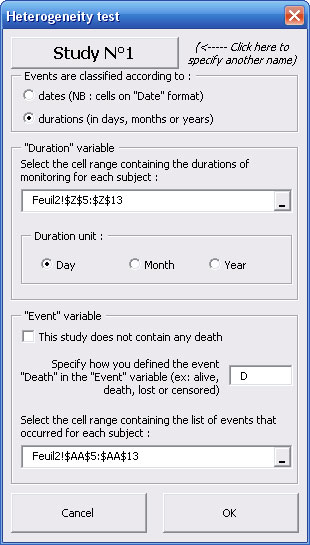
2.2 - "Study Duration" Format :
You have to select the cells range relative to durations of study for every patients, and to specify if time unit is the day, month or year. You also have to select the cells range relative to events that justify release of patients from the study, as well as the code for "Death" event in this cells range ("D" in our exemple).
Nota bene : every cells range selections must contain the same number of cells, if not, an error message will display.
Nota bene : if the code you specified to define "Death" event is not found in the "Event" variable selection, an error message will display.
Now you just have to click on the "Calculate" button.
3 - Results of heterogeneity test for comparison of survival studies :
3.1 - Actuarial Method :
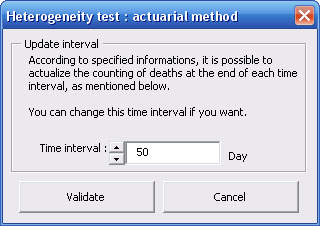
According to informations you specified about dates or study durations, StatEL is proposing you a calculated time interval. Survival calculations will be made at the end of each interval. You may change this time interval by modifying directely numerical value or by clicking on "Up/Down" arrows.
Results are displayed on a new Excel sheet and display selected data on the left part.
On the right part of results sheet, you can find details of tests of comparison applied to your K survival studies :
- tested hypothesis,
- logrank statistic,
- conclusions of the test.
The results table displays also calculation of 'Hasard Risk' (HR) of study mentionned in the column compared to study mentionned in the row. This is an estimation of ratio of hasard risks in 2 studies.
Nota bene : comparison of survival studies by actuarial method may be biased by choice of intervals duration. As the actuarial method calculates only survival probabilities when time interval is over, it neglects details offered by both studies between beginning and end of intervals. Thus, if levels are numerous (i.e. if duration interval is low), you may detect more easily difference between both studies.
Below the curve graph, a check box allows you to display on the graph 95% confidence interval for survival probability.
Each point of the curve identifies end of an interval whose duration corresponds to the value you defined in the previous dialog box.
Nota bene : last interval may be shorter than the others.
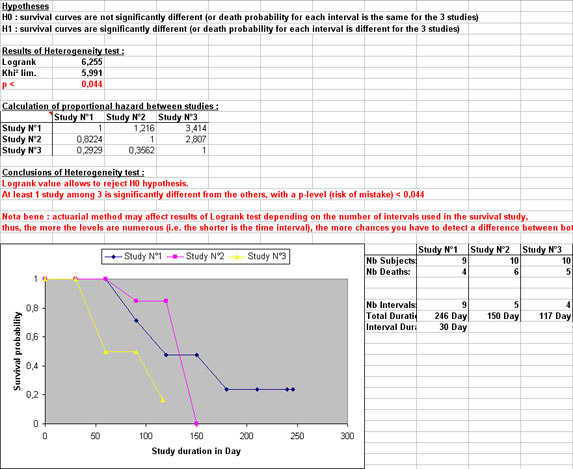
At the right of the graph, major data of survival study are displayed :
- number of subjects for each study,
- number of deceased for each subjects,
- number of intervals used to divide both survival studies,
- duration of each interval (except the last one),
- total duration of the longest study
Tables under the graph gather numerical data required to construction of survival curves, as well as data for comparison of both studies. Each column title can display a short comment that explains the content of the column.
3.2 - Kaplan-Meier's Method :
On the right part of results sheet, you can find details of tests of comparison applied to your K survival studies :
- tested hypothesis,
- logrank statistic,
- conclusions of the test.
The results table displays also calculation of 'Hasard Risk' (HR) of study mentionned in the column compared to study mentionned in the row. This is an estimation of ratio of hasard risks in 2 studies.
Nota bene : comparison of survival studies by actuarial method may be biased by choice of intervals duration. As the actuarial method calculates only survival probabilities when time interval is over, it neglects details offered by both studies between beginning and end of intervals. Thus, if levels are numerous (i.e. if duration interval is low), you may detect more easily difference between both studies.
Below the curve graph, a check box allows you to display on the graph 95% confidence interval for survival probability.
Each level of the curve is the death of a patient. Levels can be gathered or widely spread along the curve. This is why the Kaplan-Meier's method is few adapted to survival study with great effective.
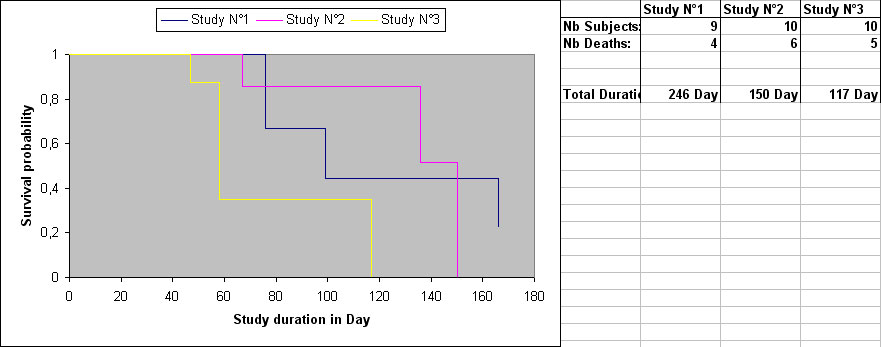
At the right of the graph, major data of survival study are displayed :
- number of subjects of the study,
- number of deceased subjects,
- total duration of the study
Table under the graph gather numerical data required to construction of survival curve, as well as data for comparison of both studies. Each column title can display a short comment that explains the content of the column.
|
|
|
| |
ad Science Company - 55, Boulevard Pereire, 75017 PARIS - France |
|
|
|