statel statistical software excel

StatEL : Bland & Altman analysis

 
This command launches the statistical methods from Bland & Altman for assessing agreement between two methods of clinical measurement.

Example: we have a reference method to measure heart rate of patients. We wish to evaluate quality of measurements of a new method compare to the reference method. Comparison will lead to measure heart rates thanks to both methods on the same patients group. Bland & Altman analysis will allow to compare couples of measurements and to evaluate bias between values displayed by both methods.

1 - Principles of Bland & Altman analysis for comparison of 2 methods of clinical measurement :

If you have data from 2 methods of clinical measurement, the most commonly mistake is to focus on Pearson's correlation between the 2 series of data. Thus, you calculate r = 0.9 (p < 0.001) and you are glad to see how efficient is the repeatability of data between both methods. Reaction to this behaviour may seem raw, but « it would be amazing if two methods designed to measure the same quantity were not related. ».

Actually, calculation and display of Pearson's correlation in such a situation is purely anecdotal because if relationship between two methods of clinical measurement is not deterministic (i.e. points do not stand along the line Y=1), this implies that there is a difference between the both methods, and analysis of « disagreement » is only accessible through representation of Bland & Altman.

In other words, if Pearson's correlation measures strength of a linear relationship between 2 quantitative variables (in our example 2 methods of clinical measurement), but not agreement between the both series of measurements. Then it is possible to calculate, on a same data set, a high Pearson's correlation coefficient and a low agreement.

Bland & Altman solved the following problem: as equality between 2 methods of clinical measurement is not verified, how is it possible to evaluate agreement between them? You want to know by how much the new method is likely to differ from the old: if this is not enough to cause problems in clinical interpretation you can replace the old method by the new or use the two interchangeably.

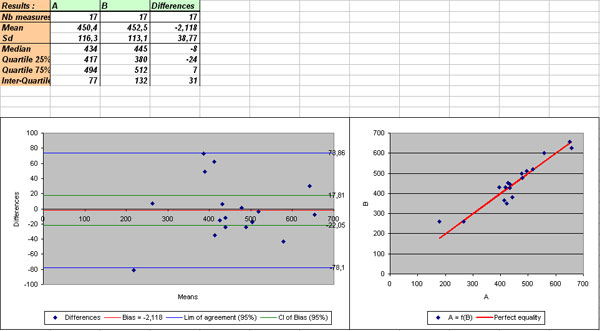
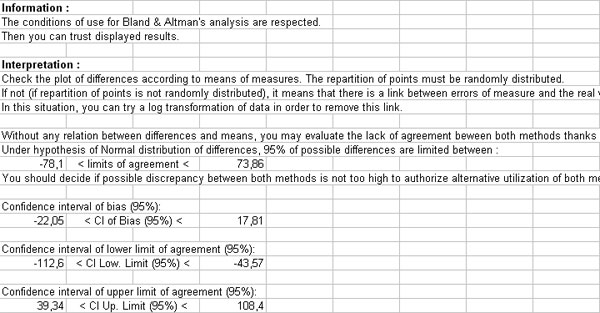
First step consists in visual analysis of plot of the difference between the methods (ordinate) against their mean (abscissa). If points' repartition is uniform (i.e. gap between couples of points is independent of their mean) then, we can calculate the bias of measures between both methods (cf. next step). On the other hand, if differences are related to means, it is recommended to practice a log transformation of data in order to "reduce" this link.

Second step consists in calculate numeric parameters to evaluate agreement between the both methods :

  • you can summarise the lack of agreement by calculating the bias, estimated by the mean d and standard deviation Sd of gaps between couples of points ;
  • limits of agreement (95%) are calculated with d +/- 1.96 Sd

95% of differences will lie between these limits d + 1.96 Sd et d - 1.96 Sd

Conditions of use (automatically checked with StatEL) : differences between both methods are distributiion-free.


2 - Launch of of the Bland & Altman analysis for comparison of 2 methods of clinical measurement :

StatEL needs you to select the range of cells related to measures of the first methods of measurement, then you have to do the same for the second methods. To carry out this selection, you have to click on the first cell of the expected data and to drag over the last cell.

Nota bene : in order to identify the different groups of measures, first cell of each selection must contains thee name of the method.

bland altman agreement between two methods of clinical measurement

bland altman agreement between two methods of clinical measurement

3 - Resultats of the Bland & Altman analysis for comparison of 2 methods of clinical measurement :

Results of analysis for assessing agreement between two methods of clinical measurement appear on a new sheet of your Excel workbook :

  • On the left part of the sheet are gathered selected data.

  • On the right part of the sheet you can see tables of descriptive statistics and results of intermediary calculations.

  • Below, you have plots of :
    • the difference between the methods (ordinate) against their mean (abscissa), completed with value of the bias between the both methods, its 95% confidence interval and 95% limits of agreement ;
    • direct representation of measures from both methods.

bland altman agreement between two methods of clinical measurement

  • At last, you have list of every numeric calculations.

bland altman agreement between two methods of clinical measurement


ad Science Company - 55, Boulevard Pereire, 75017 PARIS - France